Himax - Cost of Mobile and Renewable Power

Compare battery energy with fossil fuel and other resources

Lifting off in a large airplane is exhilarating. At a full weight of almost 400 tons, the Boeing 747 requires 90 megawatts of power to get airborne. Take-off is the most demanding part of a flight and when reaching cruising altitude the power consumption decreases to roughly half.

Powerful engines were also used to propel the mighty Queen Mary that was launched in 1934. The 81,000-ton ocean liner measuring 300 meters (1,000ft) in length was powered by four steam turbines producing a total power of 160,000hp (120 megawatts). The ship carried 3,000 people and traveled at a speed of 28.5 knots (52km/h). Queen Mary is now a museum in Long Beach, California.

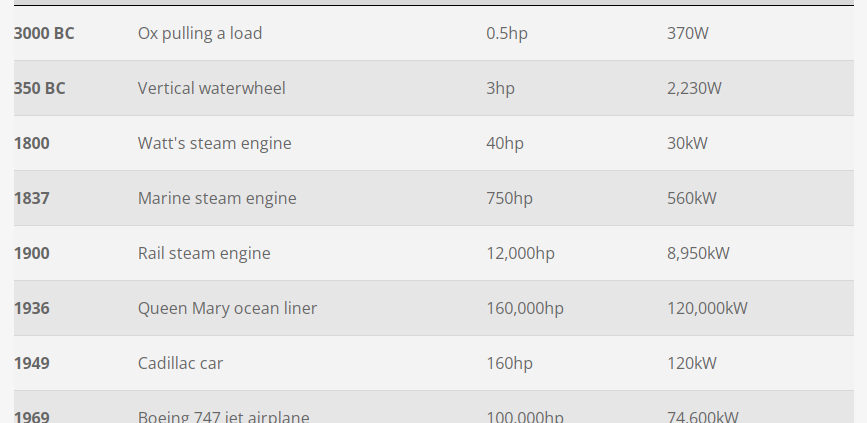
Table 1 illustrates man’s inventiveness in the quest for power by comparing an ox of prehistoric times with newer energy sources made available during the Industrial Revolution to today’s super engines, with seemingly unlimited power.

SINCE TYPE OF POWER SOURCE GENERATED POWER
3000 BC Ox pulling a load 0.5hp 370W
350 BC Vertical waterwheel 3hp 2,230W
1800 Watt’s steam engine 40hp 30kW
1837 Marine steam engine 750hp 560kW
1900 Rail steam engine 12,000hp 8,950kW
1936 Queen Mary ocean liner 160,000hp 120,000kW
1949 Cadillac car 160hp 120kW
1969 Boeing 747 jet airplane 100,000hp 74,600kW
1974 Nuclear power plant 1,520,000hp 1,133,000kW

Table 1: Ancient and modern power sources

Large propulsion systems are only feasible with the internal combustion engines (ICE), and fossil fuel serves as a cheap and plentiful energy resource. Low energy-to-weight ratio in terms of net calorific value (NCV) puts the battery against the mighty ICE like David and Goliath. The battery is the weaker vessel and is sensitive to extreme heat and cold; it also has a relatively short life span.

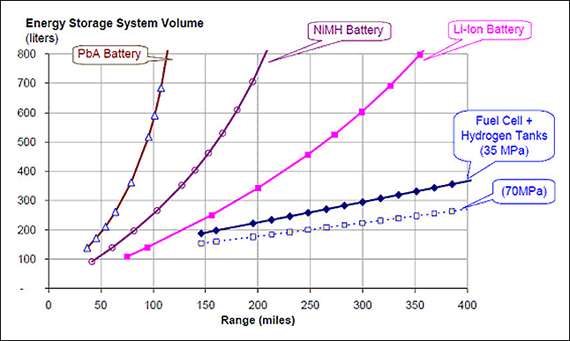
While fossil fuel delivers an NCV of 12,000Wh/kg, Li-ion provides only between 70Wh/kg and 260Wh/kg depending on chemistry; less with most other systems. Even at a low efficiency of about 30 percent, the ICE outperforms the best battery in terms of energy-to-weight ratio. The battery capacity would need to increase 20-fold before it could compete head-to-head with fossil fuel.

Another limitation of battery propulsion over fossil fuel is fuel by weight. While the weight diminishes when being consumed, the battery carries the same deadweight whether fully charged or empty. This puts limitations on EV driving distance and would make the electric airplane impractical. Furthermore, the ICE delivers full power at freezing temperatures, runs in hot climates, and continues to perform well with advancing age. This is not the case with a battery as each subsequent discharge delivers slightly less energy than the previous cycle.

Power from Primary Batteries

Energy from a non-rechargeable battery is one of the most expensive forms of electrical supply in terms of cost per kilowatt-hours (kWh). Primary batteries are used for low-power applications such as wristwatches, remote controls, electric keys and children’s toys. Military in combat, light beacons and remote repeater stations also use primaries because charging is not practical. Table 2 estimates the capability and cost per kWh of primary batteries.

AAA CELL AA CELL C CELL D CELL 9 VOLT
Capacity (alkaline) 1,150mAh 2,850mAh 7,800mAh 17,000mAh 570mAh
Energy (single cell) 1.725Wh 4.275Wh 11.7Wh 25.5Wh 5.13Wh
Cost per cell (US$) $1.00 $0.75 $2.00 $2.00 $3.00
Cost per kWh (US$) $580 $175 $170 $78 $585

Table 2: Capacity and cost comparison of primary alkaline cells. One-time use makes energy stored in primary batteries expensive; cost decreases with larger battery size.

Power from Secondary Batteries

Electric energy from rechargeable batteries is more economical than with primaries, however, the cost per kWh is not complete without examining the total cost of ownership. This includes cost per cycle, longevity, eventual replacement and disposal. Table 3 compares Lead acid, NiCd, NiMH and Li-ion.

LEAD ACID NICD NIMH LI ION
Specific energy (Wh/kg) 30–50 45–80 60–120 100–250
Cycle life Moderate High High High
Temperature performance Low when cold -50°C to 70°C Reduced when cold Low when cold
Applications UPS with infrequent discharges Rugged, high/low temperature HEV, UPS with frequent discharges EV, UPS with frequent discharges
Cost per kWh ($US)
Load leveling, powertrain
$100-200 $300-600 $300-600 $300–1,000

Table 3: Energy and cost comparison of rechargeable batteries. Although Li-ion is more expensive than Lead acid, the cycle cost may be less. NiCd operates at extreme temperatures, has the best cycle life and accepts ultra-fast charge with little stress.


Power from Other Sources

To reduce the fossil fuel consumption and to lower emissions, governments and the private sector are studying alternate energy sources. Table 4 compares the cost to generate 1kW of power that includes initial investment, fuel consumption, maintenance and eventual replacement.

Fuel type Equipment
to generate 1kW
Life span Cost of fuel
per kWh
Total cost
per kWh
Li-ion
Powertrain
$500/kW (20kW battery
costing $10,000)
2,500h (repl. cost $0.40/kW) $0.20 $0.60
($0.40 + $0.20)
ICE in vehicle $30/kW
($3,000/100kW)
4,000h (repl. cost $0.01/kW) $0.33 $0.34
($0.33 + $0.01)
Fuel cell
– portable
– mobile
– stationary
$3,000–7,500 2,000h
4,000h
40,000h
$0.35
->
->
->
$1.85 – 4.10
$1.10 – 2.25
$0.45 – 0.55
Solar cell $12,000, 5kW system 25 years $0 ~$0.10*
Electricity
electric grid
All inclusive All inclusive $0.20
(average)
$0.20

Table 4: Cost of generating 1kW of energy. Estimations include the initial investment, fuel consumption, maintenance and replacement of the equipment. Grid electricity is lowest.

* Amortization of investment yielding 200 days of 5h/day sun; declining output with age not included.

Power from the electrical utility grid is most cost-effective. Consumers pay between $0.06 and $0.40US per kWh, delivered with no added maintenance cost or the need to replace aging power-generating machinery; the supply is continuous. (The typical daily energy consumption per household in the West is 25kW.)

The supply of cheap electricity changes when energy must be stored in a battery, as is the case with a solar system that is backed up by a battery and in the electric powertrain. High battery cost and a relatively short life can double the electrical cost if supplied by a battery. Gasoline (and equivalent) is the most economical solution for mobility.

The fuel cell is most effective in converting fuel to electricity, but high equipment costs make this power source expensive in terms of cost per kWh. In virtually all applications, power from the fuel cell is considerably more expensive than from conventional methods.

Our bodies also consume energy, and an active man requires 3,500 calories per day to stay fit. This relates to roughly 4,000 watts in a 24-hour day (1 food Calorie* = 1.16 watt-hour). Walking propels a person about 40km (25 miles) per day, and a bicycle increases the distance by a factor of four to 160km (100 miles). Eating two potatoes and a sausage for lunch propels a bicyclist for the afternoon, covering 60km (37 miles, a past-time activity I often do. Not all energy goes to the muscles alone; the brain consumes about 20 percent of our intake. The human body is amazingly efficient in converting food to energy; one would think that the potato and sausage lunch could hardly keep a laptop going for that long. Table 5 provides the stored energies of calories, proteins and fat in watt-hours and joules.

Does the Fuel Cell-powered Vehicle have a Future?(Data trend chart)

Learn about the revival of the fuel cell for transportation


The fuel cell as a propulsion system is in many ways superior to a battery because it needs to carry less energy storage by weight and volume compared to a vehicle propelled by batteries only. Figure 1 illustrates the practical driving range of a vehicle powered by a fuel cell (FC) compared to lead acid, NiMH and Li-ion batteries.

Ess-volume
Figure 1: Driving range as a function of energy storage.

 The logarithmical curves of battery power place limitations in size and weight. The FC has a linear progression and is similar to the ICE vehicle.

Note: 35MPa hydrogen tank refers to 5,000psi pressure; 70MPa is 10,000psi.
Source: International Journal of Hydrogen Energy, 34, 6005-6020 (2009)+

One can clearly see that batteries simply get too heavy when increasing the size to enable greater distances. In this respect, the fuel cell enjoys similar qualities to the internal combustion engine (ICE) in that it can conquer great distances with only the addition of extra fuel.

The weight of fuel is most critical in air transport. Airlines only carry sufficient fuel to safely reach their designation, knowing that the airplane becomes more fuel efficient towards the end of the journey as the weight eases. A study group calculated that if the kerosene in an aircraft were replaced with batteries, the flight would last less than 10 minutes.

Although the fuel cell assumes the duty of the ICE in a vehicle, poor response time and a weak power band make on-board batteries necessary. In this respect, the FC car resembles an electric vehicle with an on-board charger that keeps the batteries charged. This results in short cycles that reduces battery stress over the EV; a propulsion system that bears a resemblance to the HEV.

The FC of a mid-sized car generates around 85kW (114hp) to charge the 18kWh on-board battery and drive the electric motor. On start-up, the vehicle relies fully on the battery; the fuel cell only contributes after reaching a steady state in 5–30 seconds. During the warm-up period, the battery must also deliver power to activate the air compressor and pumps. Once warm, the FC provides enough power for cruising; however, during acceleration, passing and hill-climbing both the FC and battery provide throttle power. Braking delivers kinetic energy to the battery.

Hydrogen costs about twice as much as gasoline, but the higher efficiency of the FC compared to the ICE in converting fuel to energy bring both systems on par. The FC has the added benefit of producing less greenhouse gas than the ICE.

Hydrogen is commonly derived from natural gas. Folks might ask, “Why not burn natural gas directly in the ICE instead of converting it to hydrogen through a reformer and then transforming it to electricity in a fuel cell to feed the electric motors?” The answer is efficiency. Burning natural gas in a combustion turbine to produce electricity has an efficiency factor of only 26–32 percent while a fuel cell is 35–50 percent efficient. That said, the machinery required to support the FC is costlier and requires more maintenance than a simple burning process.

To complicate matters further, building a hydrogen infrastructure is expensive. A refueling station capable of reforming natural gas to hydrogen to support 2,300 vehicles costs over $2 million, or $870 per vehicle. In comparison, a Level 2 charging outlet to charge EVs can easily be installed by connecting to the existing electric grid. The benefit with FC is a quick refill similar to filling a tank with liquid fuel.

Durability and cost are further deterrents for the FC, but improvements are made. The service life of an FC-powered car has doubled from 1,000 hours to 2,000 hours. The target for 2015 is 5,000 hours, or a vehicle life of 240,000km (150,000 miles).

A further challenge is vehicle cost as the fuel cell is more expensive to build than an ICE. As a guideline, an FC vehicle is more expensive than a plug-in hybrid, and the plug-in hybrid is dearer than a gasoline-powered car. With low fuel prices, alternative propulsion systems are difficult to justify on cost alone and the environmental benefits must be considered. Japan is making renewed efforts with FC propulsion to offer an alternative to the ICE and the EV. Toyota plans to phase out the ICE by 2050 and other vehicle makers are observing the trend.

Himax Batteries in Industries Application scenarios

Learn about unique applications and what features to look for when choosing a battery.

Consumers are the first to hear about an apparent battery breakthrough. To get top media attention, the new super battery promises to also satisfy the need for electric vehicle (EV). Personal mobility is an emotional issue that cannot be suppressed, even if it harms the environment. The industrial space, on the other hand, is more conservative and it appears to lag behind. Not so. Industry is rational and understands the many constraints of the battery by focusing on reliability, economy, longevity and safety.

Batteries for Traction

Wheelchairs, scooters and golf cars mostly use lead acid batteries. Even though heavy, lead acid works reasonably well and only moderate attempts are made to switch to other systems Li-ion will be a natural alternative in many applications.

Although Li-ion is more expensive than lead acid, the cycle cost can be lower because of the longer life. A further advantage of Li-ion over lead- and nickel-based batteries is the low maintenance. Li-ion can be left at any state-of-charge without adverse side effects. In contrast, NiCd and NiMH need an occasional full discharge to prevent memory and lead acid requires a saturated charge to prevent sulfation.

Most wheelchairs and golf cars are still powered with lead acid, so are forklifts. With forklifts, the heavy weight is less of an issue, but the long charging time is a disadvantage for warehouses operating 24 hours a day. Some forklifts are fitted with fuel cells that charge the battery while the vehicle is in use. The battery can be made smaller but not eliminated because the fuel cell has poor power delivery and has a sluggish ramp-up on demand; the battery remains the primary power source.

The heavier the wheeled application is, the less suitable the battery becomes. This does not prevent engineers from looking into large battery systems to replace the polluting internal combustion engine (ICE). One such application is the Automatic Guided Vehicle (AGV) system at ship ports. AGVs run 24 hours a day and the vehicles cannot be tied up for lengthy charging intervals. Li-ion solves this in part by replacing the very large 10-ton, 300kWh lead acid with a battery that is lighter and can be charged more quickly. But very large batteries have a limitation because of weight, charging time and infrastructure and the fuel cell may solve large traction systems as described in BU-1005 if burning fossil fuel is not an option.

However, no economical battery solution exists yet for large traction systems and burning fossil fuel cannot be fully avoided. While a modern Li-ion battery delivers about 150Wh/kg of energy, the net calorific value (NCV) of fossil fuel is over 12,000Wh/kg. Even at the low 25-percent efficiency of an ICE engine, the energy from a battery is fractional compared to fossil fuel (see BU-1007: Net Calorific Value). Furthermore, the ICE can operate in extreme cold and heat, a task the battery struggles to meet.

Himax - LiFePO4-Battery

Batteries for Aviation

The duty of batteries on board an aircraft is to feed navigation and emergency systems when the Auxiliary Power Unit (APU) is off or during an emergency in flight. The battery provides power for braking, ground operation and starting the APU. In the event of engine failure, the batteries must supply energy from 30 minutes to 3 hours. Each aircraft must also have enough battery power to facilitate a safe landing. During flight, the electrical power is supplied by generators and, similar to a car, the on-board battery could be disconnected if so required.

Most commercial jetliners use flooded nickel-cadmium. Starting a large aircraft begins by spooling the APU, a small turbine engine located at the tail section of an airplane. This takes significantly longer and requires more energy than cranking a reciprocating engine of similar size. The spooling speed of the APU must be sufficiently high to attain compression for self-sustained ignition. Starting takes about 15 seconds and consumes 15kW of energy. Once running, an air compressor or hydraulic pump jumpstarts the large jet engines one-by-one.

Smaller aircraft often have sealed lead-acid. Although heavier than NiCd, lead acid requires less maintenance. The 12 and 24V aviation batteries are rated in IPP (current peak power)* and IPR (current power rating)** rather than CCA (cold cranking amps) as is common in the automotive industry. IPP and IPR are the International Electrotechnical Commission (IEC 60952-1) standard for aircraft batteries and FAA TSO-C173 that allow a battery to spool each engine for 25–40 seconds at high current.

Modern jet fighters spool the jet engines with Li-ion, so does the Boeing 787 Dreamliner. The Airbus 350 offers the option of either chemistry. As the on-board functions of an airliner move from hydraulic to electrical, larger batteries are required. The higher energy-dense Li-ion satisfies this demand better than NiCd and lead acid. However, unexpected Li-ion failure with serious consequences may move airplane makers back to NiCd. All batteries are subject to breakdowns; there are also reported heat failures with NiCd, but these can be better managed than Li-ion.

NiCd provides durability and reliable service, but it needs high maintenance that includes exercising the battery to eliminate memory. The service of the main-ship battery consists of a total discharge and shorting each cell for 24 hours with a strap. The battery is also checked for capacity with a battery analyzer. Smaller NiCd batteries have different service requirements.

Although aircraft carry many different batteries aboard, their sole purpose is to start the engine and provide backup power when the engines are off. Large aircraft will continue to fly on fossil fuel as batteries are not yet practical for propulsion. Small battery-powered airplanes are being tried for pilot training and to fly short hops but these are experimental only. Weight and reliability on an aging battery remain major concerns.


*Ipp: Peak current delivered at 0.3 seconds into a 15 second controlled discharge at a constant terminal voltage of half the nominal battery voltage.
**Ipr: This is the discharge current at the conclusion of a 15 second controlled discharge at a constant terminal voltage of half the nominal battery voltage.

Batteries for Aerospace

Early satellites used NiCd batteries, and this led to the discovery of the “memory” phenomenon. The battery followed a routine discharge schedule but when more energy was demanded, the battery could remember. The voltage would drop as if to protest against unwanted overtime.

NiCd was replaced by nickel-hydrogen as a battery with an exceptional long service life. Entrepreneurs tried to introduce this amazing battery for commercial use but high price and large size spoiled market acceptance. Each cell costs around $1,000 and has the appearance of a small steam engine with a steel pressure tank.

Li-ion is the battery of choice for satellites. It is light-weight, easy to charge, durable and cycles well. Li-ion can dwell in any SoC for an extended length of time without adverse side effects; it has low self-discharge and is virtually maintenance free.

The Mars Curiosity Rover uses specially designed lithium nickel oxide cells (LiNiCo) in 8S2P formation (eight cells in series and two in parallel) that is only partially charged and discharged to stretch longevity. Under this regime, the life span is four years and roughly 700 sol. (The term sol is used by planetary astronomers to refer to the duration of a solar day on Mars.) The 43Ah cells, of which two are in parallel, have a maximum discharge C-rate of 0.55C.

NASA wants Li-ion batteries to last for 7 years and 37,000 cycles with a DoD of 40 to 60 percent. NASA labs reveal that end-of-life is connected with the growth of the SEI layer on the anode, loss of cathode material, loss of conductive path, plating of metallic lithium and electrolyte oxidation. Large 140Ah Li-ion cells are in development that promise to last up to 18 years. (See also BU-808B: What causes Li-ion to die?)

Stationary Batteries

With a growing choice of batteries for energy storage systems (ESS), the selection should not be based on price alone. Cost per kWh says little without also examining the total cost of ownership that includes cost per cycle, longevity and eventual replacement.

Lead acid is well suited for duties that need only occasional discharges. The flow battery and sodium-sulfur battery work well for large systems requiring regimented discharges, while lithium ion is recommended for small to medium systems delivering short discharging with fast charging ability multiple times a day.

Traditionally, stationary batteries have been lead acid. Size and weight is of lesser concern, and the limited cycle count does not pose a problem when the batteries are seldom discharged. Large stationary batteries are mostly flooded and require regular checking of the electrolyte level. This maintenance can be reduced with an automatic watering system.

Valve-regulated lead acid (VRLA) is the low-maintenance version of the flooded lead acid. It is said that VRLA can be installed and forgotten, but this is often taken to the extreme in that the batteries get neglected. Maintenance includes checking the voltage, internal resistance and sometimes capacity levels.

Applications that are exposed to hot and cold temperatures as well as those requiring deep cycling are often served by flooded nickel-cadmium. These batteries are more rugged than lead acid but are roughly four times the cost. Flooded nickel-cadmium batteries are non-sintered and are less subject to memory that the sintered versions, which are sealed, but some maintenance is still required. NiCd is the only battery that can be rapidly charged with minimal stress.

Many stationary batteries are also served by Li-ion. Li-ion comes with many advantages, but the battery does not perform as well as NiCd and lead acid at low temperature. Another battery that is making a comeback for stationary use is nickel-iron.Inventor Thomas Edison promoted NiFe for the electric vehicle, but it eventually lost out to lead acid due to high cost and high self-discharge. Improvements have eliminated some of the failings, and the superior durability of this battery is gaining renewed interest.

Energy Storage Systems (Grid Storage Batteries)

Renewable energy sources such as wind and sun do not provide a steady stream of energy, nor do they always harmonize with user demand. Large energy storage systems (ESS) called load leveling or grid storage batteries are needed to provide a seamless service.

ESS enjoys a large growth trajectory to move from coal and oil to renewable resources. ESS installations in South Africa alone are estimated to reach 1,500MWh by 2021. Chemistries under consideration are flow batteries, Li-ion, lead acid and zinc-bromine. Zinc-bromine is a type of hybrid flow battery that can be regarded as an electroplating machine. During charge, zinc electroplates onto conductive electrodes forming bromine; the process reverses on discharge. Another leading ESS battery is the high temperature sodium-sulfur battery.

Storing energy to supply peak shaving power is not new. Hydroelectric power stations use excess electricity to pump water back up to the reservoir at night for use the next day. With an efficiency factor of 70–85 percent, pumped hydro is easier to manage than adjusting the generators to the exact power need. Pumping compressed air into large underground cavities and underwater balloons are also being used to store energy.

Flywheels also serve as energy storage. Large electric motors rev up one-ton flywheels when excess energy is available to supply brief energy deficiencies. High-speed flywheels spin at over 30,000 rpm on magnetic bearings in a vacuum chamber. Electric motors/generators with permanent magnets charge and discharge the kinetic energy on demand.

Modern flywheels replace steel with carbon fibers to withstand higher rotations of up to 60,000 rpm. Energy increases by the square of speed, providing four times the power at a reduced weight. Should the flywheel fail, the housing prevents shrapnel form escaping.

Using flywheels to store kinetic energy is not new. In the 1940s and 1950s, city busses in Switzerland were powered by flywheels. An electric motor would spin a 3-ton flywheel to 3,000 rpm in 3 minutes. Turning into a generator, the motor would then transform the energy back into electricity. Each charge would yield for 6km (3.75mi) on a flat road. The bus was pollution-free but the gyroscope action resisted changing direction on a windy road.

Load leveling is gravitating towards Li-ion because of small footprint, low maintenance and long life. Li-ion does not suffer from sulfation as lead acid does when not fully charged periodically. This can be a major drawback with installations when demand exceeds supply. Li-ion also has the benefit of being light-weight and semi-portable for installations in remote locations. The negatives of Li-ion are its high price and low performance at cold temperature. A further drawback is the inability to charge below freezing.

Li-ion has come down in price and Table 1 provides a cost comparison with lead acid for grid storage applications. Although the initial price of Li-ion is higher than lead acid, the cost per cycle is lower in deep-cycle applications. Li-ion is said to gain in market share but lead acid will keep its stronghold.

LEAD ACID LI-ION
Battery cost $20,000 $52,000
Lifespan 500 cycles at 50% DoD 1,900 cycles at 90% DoD
Cost per cycle $40 $28

Table 1: Cost comparison of lead acid and Li-ion for renewable energyLi-ion has a higher initial cost but is lower on the cost per cycle. Prices are estimated.
Courtesy: http://www.powertechsystems.eu/en/technics/lithium-ion-vs-lead-acid-cost-analysis

The energy output of a large industrial wind turbine is 1 megawatt (MW) and more; the biggest units have grown to 10MW. Several turbines form a wind farm that produces 30–300MW. To fathom a megawatt, 1MW feeds 50 houses or a Walmart superstore.

Not all renewable energy systems include load leveling batteries. The batteries simply get too large and the investment cannot always be justified. If supported by batteries, a 30MW wind farm uses a storage battery of about 15MW. This is the equivalent of 20,000 starter batteries or 176 Tesla S 85 EVs with an 85kWh battery each. The cost to store energy in a battery is high, and some say it doubles the cost to a direct supply.

The battery management system (BMS) keeps the battery at about 50 percent charge to allow absorbing energy on wind gusts and delivering on high load demands. Modern BMS can switch from charge to discharge in less than a second. This helps stabilize the voltage on transmission lines, also known as frequency regulation.

Data trend chart - Hybrid Electric Vehicles and the Battery

Hybrid Electric Vehicle (HEV)

Governments are asking the public to reduce fuel consumption and lower pollution. They do this without imposing a change in driving habits and the HEV fits the bill. Japan is leading in adapting the HEV because of high fuel costs and environmental concerns.

The purpose of the HEV is to conserve fuel without sacrificing performance, and the HEV achieves this by using one or several electric motor to assist the ICE during acceleration and to harness kinetic energy when braking. The ICE turns off at traffic lights and the electric motor propels the car through slow-moving traffic. On full power, both the ICE and electric motor engage for optimal acceleration.

The HEV uses a mechanical powertrain to transfer power from the ICE to the wheels. In this respect, the HEV resembles an ordinary vehicle with a crankshaft and a clutch, also known as parallel configuration. Fuel savings are achieved by the use of a smaller ICE that is tuned for maximum fuel efficiency rather than high torque. Toyota claims a thermal efficiency of 40 percent for the new Prius. Peppy driving is accredited to the electric motor as this propulsion system delivers far better torque than a sluggish ICE of the same horsepower. Figure 1 illustrates the different modes of an electrified powertrain in in an HEV.

HEV Battery

Figure 1: Basic function or an electrified powertrain in an HEV.
Battery power is only used for short durations. The HEV battery seldom encounters full charge-discharge cycles that are common in the electric vehicle.
Source: RWTH Aachen University, Germany

Most batteries for HEVs are guaranteed for 8 years. To meet this long service life, the cells are optimized for longevity rather than high specific energy as with consumer products. The battery maker achieves this in part by using a thicker and more durable separator. To reduce stress, the battery operates at 30–80 percent state-of-charge (SoC), or roughly 3.5–4.0V/cell for Li-ion, rather than the customary 3.0–4.20V/cell.

HEV batteries operate momentarily and share similarity with a starter battery by applying short power bursts for acceleration rather than long, continuous discharges as with the EV. Rarely will an HEV battery discharge to a low 20 percent state-of-charge (SoC). Under normal use, a parallel HEV consumes less than 2 percent of the available battery capacity per mile (1.6km). Capacity fade goes unnoticed, and an HEV battery still works well with less than half the original capacity.

Figure 2 shows the battery capacity of six hybrid cars at a 256,000km (160,000 miles). The test was done by the US Department of Energy’s FreedomCAR and Vehicle Technologies Program (FCVT) in 2006 according to SAE J1634 practices and it included the Honda Civic, Honda Insight and Toyota Prius.

Untitled

Figure 2: End-of-life battery capacity of HEVs. At 256,000km (160,000 miles), the two Honda Civic vehicles had 68% capacity, the Insight had 85% and the Prius had 39%. The capacity fade did not affect the fuel efficiency by much.
Source: FreedomCAR and Vehicle Technologies Program

The hybrid battery of the two Honda Civic vehicles had 68 percent remaining capacity; the Insight had 85 percent and the Prius 39 percent. Even with lower capacity at the end of life, the fuel efficiency was not severely affected. The Insight showed a 1.2mpg (0.12L/km) decrease in fuel economy during the test, while the Prius reduced the fuel efficiency by 3.2mpg (0.33L/km). Air-conditioning was off in both cases.

Stringent battery demands are needed for hybrid trucks with a gross vehicle weight of 33 tons (73,000 lb). The battery must be able to continuously charge and discharge at 4C, deliver 10kW (200hp) for up to 10 minutes, operate at –20°C to 40°C (–4°F to 104°F) and deliver 5 years of service. Supercapacitors would provide the required durability but high cost and low energy density are against this choice. Lead acid has good discharge characteristics but it is slow to charge. Li-ion, especially LTO, would be a good choice but high power draw requires active cooling. Second generation NiMH is being tested; the rugged NiCd may also be tried.

Paradox of the hybrid vehicle

As good as a hybrid may be, the car is not without ironies. At a conference addressing advanced automotive batteries, an HEV opponent argued with an HEV maker that a diesel car offers better fuel economy than a hybrid. Being a good salesman, the HEV maker flatly denied the claim. Perhaps both are right. In city driving, the HEV clearly delivers better fuel-efficiency while diesel consumes less on the highway. Combining both would provide the best solution, but the high cost of a diesel-hybrid solution might not pay back with low fuel prices, although such vehicles are available in Europe.

High-end HEVs come with a full-sized ICE of 250hp and an electrical motor of 150–400hp in total. Such vehicles will surely find buyers, especially if the government assists with grants for being “green.” It’s unfortunate that consumers who walk, cycle or take public transportation won’t get such handouts. Common sense reminds us to conserve energy by driving less, or using smaller vehicles when driving is necessary.

Wolfgang Hatz, the then head of powertrain for Volkswagen Group, said that hybrid technology is a very expensive way to save a small amount of fuel and states that Volkswagen only makes hybrids because of political pressure. He supports diesel as the most energy-efficient motor, especially on highways.

Volkswagen may have a solution — the 1-Liter Car (Figure 3). It is called the 1-Liter Car because the concept vehicle burns only one liter of fuel per 100km. To prove the concept, the then VW chairman Dr. Ferdinand Piëch drove the car from their headquarters in Wolfsburg to Hamburg for a shareholders meeting. The average consumption was just 0.89 liters per 100km (317mpg).

Figure 3: Volkswagen’s 1-Liter Car. The 1-Liter Car is said to be the most economical car in the world but it never made it into production.
Source: Volkswagen AG

Aerodynamics and weight help to achieve the low fuel consumption. While a typical car has a drag coefficient of 0.30, the 1-Liter Car is only 0.16. Carbon fiber and a magnesium frame reduce the weight to 290kg (640lb). The one-cylinder diesel engine generates 8.5hp (6.3kW), and the 6.5-litre (1.43-gallon) fuel tank has a range of 650 kilometers (400 miles). The average fuel consumption is 0.99 liter per 100km (238mpg).

Although the 1-Liter Car did not go into production, VW demonstrated that fossil fuel could be stretched should the cost rise or should frivolous consumption create unsustainably high pollution levels. Point-to-point personal transportation could be made possible with a light carrier that weighs only 290kg, a weight that is less than the 540kg Tesla S battery. Rather than consuming 150–250Wh per kilometer, as with an electric vehicle, the 1-Liter Car would only use about 40Wh/km. Even though it burns fossil fuel, the environmental impact would be less than an EV propelled with electricity, which is mainly produced by fossil fuel.

Plug-in Hybrid Electric Vehicle (PHEV)

Most PHEVs use a fully electrified powertrain in a series configuration with no mechanical linkage from ICE to wheels. The system runs solely on the electric motor for propulsion, and the ICE only engages when the batteries get low to supply electricity for the electric motor and to charge the battery. The driving range of a fully charged battery is about 50km (30 miles).

The PHEV is ideal for commuting and doing errands. No gasoline is consumed when driving on batteries and the highways are tax-free. However, there will be an increase in the electrical utility bill to charge the batteries at home.

Unlike the parallel HEV that relies on the battery for only brief moments, the PHEV battery is in charge depletion mode, meaning that the battery must work harder than on an HEV. This adds to battery stress and reduces longevity. While a capacity drop to 39 percent will affect the performance of the Toyota Prius HEV only marginally, such a loss would reduce the electric driving range of a PHEV from 50km to 20km (30 to 12 miles).

The Chevy Volt carries a 16kWh Li-ion battery that weighs 181kg (400 lb) and powers a 149hp (111kW) electric motor. The temperature of the prismatic cells is kept at 20–25C (68–77F) during charging and driving. An 115VAC outlet fills the battery in 8 hours; a 230VAC reduces the charging time to 3 hours. The driving range is 64km (40 miles) before the 1.4-liter four-cylinder ICE kicks in to activate the 53kW AC generator that powers the electric motors.

Economics

As good as the PHEV sounds, the long-term savings may be smaller than expected, especially if a battery replacement is needed during the life of the car. Battery aging is an issue that car makers avoid mentioning in fear of turning buyers away. A motorist used to driving ICE cars expects ample power at hot and cold temperatures and minimal performance degradation with age. The battery cannot match this fully, and the owner will need to tolerate a decrease in driving range during the winter, as well as accept a small reduction in delivered mileage with each advancing year due to battery aging.

Modern cars do more than provide transportation; they also include amenities for safety, comfort and pleasure. The most basic of these are the headlights and windshield wipers. Buyers also want cabin heat and air-conditioning, services that are taken for granted in a vehicle that burns fossil fuel. Heat is a by-product in the ICE that must be generated with battery power in a PHEV, but the larger concern is air-conditioning, which draws 3–5kW of power. Comforts might need to be provided more sparingly when running on a battery.

Many PHEV buyers value the environmental benefit and the pleasure of driving a quiet vehicle powered by electricity. This has a large buyer appeal because electric propulsion is more natural than that of an ICE. Drivers must adapt to the new lifestyle of charging the vehicle at night when electricity is cheap and then driving measured distances. Users of these cars will also appreciate new charging stations at workplaces and shopping malls.

Data trend chart - Gsm-Discharges-Liion

Discover what causes short runtimes

Not all battery energy can or should be used on discharge; some reserve is almost always left behind on purpose after the equipment cuts off. There are several reasons for this.

Most mobile phones, laptops and other portable devices turn off when the lithium-ion battery reaches 3.00V/cell on discharge. At this point the battery has about 5 percent capacity left. Manufacturers choose this voltage threshold to preserve some energy for housekeeping, as well as to reduce battery stress and allow for some self-discharge if the battery is not immediately recharged. This grace period in empty state can last several months until self-discharge lowers the voltage of Li-ion to about 2.50V/cell, at which point the protection circuit opens and most packs become unserviceable with a regular charger.

Power tools and medical devices drawing high current tend to push the battery voltage to an early cut-off prematurely. This is especially apparent at cold temperatures and in cells with high internal resistance. These batteries may still have ample capacity left after the cutoff; discharging them with a battery analyzer at a moderate load will often give a residual capacity of 30 percent. Figure 1 illustrates the cut-off voltage graphically.

Figure 1: Illustration of equipment with high cut-off voltage.

Portable devices do not utilize all available battery power and leave some energy behind.


To prevent triggering premature cutoff at a high load or cold temperature, some device manufacturers may lower the end-of-discharge voltage. Li-ion in a power tool may discharge the battery to 2.70V/cell instead of 3.00V/cell; Li-phosphate may go to 2.45V/cell instead of 2.70V/cell, lead acid to 1.40V/cell instead of the customary 1.75V/cell, and NiCd/NiMH to 0.90V/cell instead of 1.00V/cell.

Industrial applications aim to attain maximum service life rather than optimize runtime, as it is done with consumer products. This also applies to the electric powertrain; batteries in a hybrid cars and electric vehicle electric vehicles are seldom fully discharged or charged; most operate between 30 and 80 percent state-of-charge when new. This is the most effective working bandwidth; it also delivers the longest service life. A deep discharge to empty followed a full charge would cause undue stress for the Li-ion. Similarly, satellitesuse only the mid-band of a battery called the “sweet zone.” Figure 2 illustrates the “sweet zone” of a battery.

Figure 2: Sweet zone of a Lithium-ion battery to extend life.

Operating Li-ion in the “sweet zone” prolongs battery life because a partial cycle is less stressful than a full cycle. As the capacity fades with use, the battery management system (BMS) may engage the full working range of the battery.


Elevated internal resistance makes alkaline and other primary batteries unsuitable for high load applications. The resistance rises further as the cell depletes. This causes an early cutoff with the device drawing some current, and much energy is left behind. Primary batteries have high capacities and perform well when new, but they soon lose power like a deflating balloon.

Equivalent_Full_Cycles Data trend chart

Understanding the importance of low conductivity

Capacity alone is of limited use if the pack cannot deliver the stored energy effectively; a battery also needs low internal resistance. Measured in milliohms (mΩ), resistance is the gatekeeper of the battery; the lower the resistance, the less restriction the pack encounters. This is especially important in heavy loads such as power tools and electric powertrains. High resistance causes the battery to heat up and the voltage to drop under load, triggering an early shutdown. Figure 1 illustrates a battery with low internal resistance in the form of a free-flowing tap against a battery with elevated resistance in which the tap is restricted.

low-Resistance

Low resistance, delivers high current on demand; battery stays cool.

High-Resistance

High resistance, current is restricted, voltage drops on load; battery heats up.


Figure 1: Effects of internal battery resistance.

A battery with low internal resistance delivers high current on demand. High resistance causes the battery to heat up and the voltage to drop. The equipment cuts off, leaving energy behind.

Lead acid has a very low internal resistance and the battery responds well to high current bursts that last for a few seconds. Due to inherent sluggishness, however, lead acid does not perform well on a sustained high current discharge; the battery soon gets tired and needs a rest to recover. Some sluggishness is apparent in all batteries at different degrees but it is especially pronounced with lead acid. This hints that power delivery is not based on internal resistance alone but also on the responsiveness of the chemistry, as well as temperature. In this respect, nickel- and lithium-based technologies are more responsive than lead acid.

Sulfation and grid corrosion are the main contributors to the rise of the internal resistance with lead acid. Temperature also affects the resistance; heat lowers it and cold raises it. Heating the battery will momentarily lower the internal resistance to provide extra runtime. This, however, does not restore the battery and will add momentary stress.

Crystalline formation, also known as “memory,” contributes to the internal resistance in nickel-based batteries. This can often be reversed with deep-cycling. The internal resistance of Li-ion also increases with use and aging but improvements have been made with electrolyte additives to keep the buildup of films on the electrodes under control. With all batteries, SoC affects the internal resistance. Li-ion has higher resistance at full charge and at end of discharge with a big flat low resistance area in the middle.

Alkaline, carbon-zinc and most primary batteries have a relatively high internal resistance, and this limits their use to low-current applications such as flashlights, remote controls, portable entertainment devices and kitchen clocks. As these batteries deplete, the resistance increases further. This explains the relative short runtime when using ordinary alkaline cells in digital cameras.

Two methods are used to read the internal resistance of a battery: Direct current (DC) by measuring the voltage drop at a given current, and alternating current (AC), which takes reactance into account. When measuring a reactive device such as a battery, the resistance values vary greatly between the DC and AC test methods, but neither reading is right or wrong. The DC reading looks at pure resistance (R) and provides true results for a DC load such as a heating element. The AC reading includes reactive components and provides impedance (Z). Impedance provides realistic results on a digital load such as a mobile phone or an inductive motor.

Figure 2 illustrates the internal resistance of an 18650 Li-ion cell when exposed to 1,000 full cycles at 40ºC (104ºF). The AC readings in the green frame do not reflect the true resistive state of a battery; DC method provides more reliable performance data with loading.

Equivalent_Full_Cycles
Figure 2: Rise of internal resistances of 18650 Li-ion cell measured with AC and DC methods when cycled.
AC resistance readings in green frame stay low; DC method gives true state.
Source: Technische Universität München (TUM)

Pack Resistance

The internal resistance of a battery does not consist of the cells alone but also includes the interconnection, fuses, protection circuits and wiring. In most cases these peripherals more than double the internal resistance and can falsify rapid-test methods. Typical readings of a single cell pack for a mobile phone and a multi-cell battery for a power tool are shown below.

Internal Resistance of a Mobile Phone Battery

Cell, single, high capacity prismatic 50mΩ subject to increase with age
Connection, welded 1mΩ
PTC, welded to cable, cell 25mΩ 18–30 mΩ according to spec
Protection circuit, PCB 50mΩ
Total internal resistance ca. 130mΩ

Internal Resistance of a Power Pack for Power Tools

Cells 2P4S at 2Ah/cell, 18mΩ subject to increase with age
Connection, welded, each 0.1mΩ
Protection circuit, PCB 10mΩ
Total internal resistance ca. 80mΩ

Source: Siemens AG (2015, München)

Figures 3, 4 and 5 reflect the runtime of three batteries with similar Ah and capacities but different internal resistance when discharged at 1C, 2C and 3C. The graphs demonstrate the importance of maintaining low internal resistance, especially at higher discharge currents. The NiCd test battery comes in at 155mΩ, NiMH has 778mΩ and Li-ion has 320mΩ. These are typical resistive readings on aged but still functional batteries. That demonstrates the relationship of capacity, internal resistance and self-discharge.)

Gsm-Discharges-Nicd
Figure 3: GSM discharge pulses at 1, 2, and 3C with resulting talk-time
The capacity of the NiCd battery is 113%; the internal resistance is 155mΩ. 7.2V pack.


Gsm-Discharges-Nimh
Figure 4: GSM discharge pulses at 1, 2, and 3C with resulting talk-time
The capacity of the NiMH battery is 94%, the internal resistance is 778mΩ. 7.2V pack


Gsm-Discharges-Liion
Figure 5: GSM discharge pulses at 1, 2, and 3C with resulting talk-time
The capacity of the Li-ion battery is 107%; the internal resistance is 320mΩ. 3.6V pack

Notes: The tests were done when early mobile phones were powered by NiCd, NiMH and Li-ion. Li-ion and NiMH have since improved.

The maximum GSM draws is 2.5A, representing 3C from an 800mAh pack, or three times the rated current.

Data trend chart - How to Define Battery Life

Become familiar with battery fade and how the ready light can deceive the user.

Folks have been using rechargeable batteries for over 100 years but this marvelous power source is still poorly understood. The battery is a silent worker that delivers energy until it quits of exhaustion and old age. It is more prone to failure than most other parts in a system. Much is expected but little is given in return. With a shorter life span than the host device, battery replacement becomes an issue, and the “when” and “what if” are not well defined by the device manufacturer. Some batteries are replaced too soon but most stay too long.

A portable system works well when the batteries are new but confidence drops after the first packs need replacing due to capacity fade. In time, the battery fleet becomes a jumble of good and bad batteries, and that’s when the headache begins. Battery management mandates that all batteries in a fleet are kept at an acceptable capacity level. Packs that fall below a given threshold must be replaced to keep system integrity. Battery failure occurs most often on a heavy traffic day or in an emergency when more than normal service is demanded.

Batteries exhibit human-like qualities and need good nutrition. Care begins by operating at room temperate and discharging them at a moderate current. There is some truth as to why batteries cared for by an individual user outperform those in a fleet; studies can back this up.

Charging is generally well understood, but the “ready” light is misconstrued. Ready does not mean “able.” There is no link to battery performance, nor does the green light promise full runtime. All batteries charge fully, even if weak; “ready” simply means that the battery is full.

The capacity a battery can hold diminishes with age and the charge time shortens with nickel-based batteries and in part also with lead acid, but not necessarily with Li-ion. Lower charge transfer capability that inhibits the flow of free electrons prolongs the charge time with aged Li-ion. (See BU-409a: Why do Old Li-ion Batteries Take Long to Charge?)

A short charging time propels faded batteries to the top, disguised as combat ready. System collapse is imminent when workers scramble for freshly charged batteries in an emergency; those that are lit-up may be deadwood. (Note that the charge time of a partially charged battery is also shorter.) Figure 1 shows the “ready” light that is known to lie.

Figure 1: The “ready” light lies. The READY light indicates that the battery is fully charged. This does not mean “able” as there is no link between “ready” and battery performance.

The amount of energy a battery can hold is measured in capacity. Capacity is the leading health indicator that determines runtime and predicts end of battery life when low. A new battery is rated at 100 percent, but few packs in service deliver the full amount: a workable capacity bandwidth is 80–100 percent. As a simple guideline, a battery on a two-way radio having a capacity of 100 percent would typically provide a runtime of 10 hours, 80 percent is 8 hours and 70 percent, 7 hours.

The service life of a battery is specified in number of cycles. Lithium- and nickel-based batteries deliver between 300 and 500 full discharge/charge cycles before the capacity drops below 80 percent.

Cycling is not the only cause of capacity loss; keeping a battery at elevated temperatures also induces stress. A fully charged Li-ion kept at 40°C (104°F) loses about 35 percent of its capacity in a year without being used. ( See BU:808: How to Prolong Lithium-based Batteries ). Ultra-fast chargers and harsh discharging is also harmful. This cuts battery life to half, and hobbyists can attest to this.

Himax - cycle-life-lead-acid(Data trend chart)

Discover what a battery needs to get going and maintain a long life.

In many ways, a battery behaves like a human being. It senses the kindness given and delivers on the care given. It is as if the battery has feelings and returns on the benevolence bestowed. But there are exceptions, as any parent raising a family will know; and the generosity conferred may not always deliver the anticipated returns.

To become a good custodian, you must understand the basic needs of a battery, a subject that is not taught in school. This section teaches what to do when the battery is new, how to feed it the right “food” and what to do when putting the pack aside for a while. Chapter 7 also looks into restrictions when traveling with batteries by air and how to dispose of them when their useful life has passed.

Just as a person’s life expectancy cannot be predicted at birth, neither can we date stamp a battery. Some packs live to a great old age while others die young. Incorrect charging, harsh discharge loads and exposure to heat are the battery’s worst enemies. Although there are ways to protect a battery, the ideal situation is not always attainable. This chapter discusses how to get the most from our batteries.

Priming a New Battery

Not all rechargeable batteries deliver the rated capacity when new, and they require formatting. While this applies to most battery systems, manufacturers of lithium-ion batteries disagree. They say that Li-ion is ready at birth and does not need priming. Although this may be true, users have reported some capacity gains by cycling after a long storage.

“What’s the difference between formatting and priming?” people ask. Both address capacities that are not optimized and can be improved with cycling. Formatting completes the fabrication process that occurs naturally during use when the battery is being cycled. A typical example is lead- and nickel-based batteries that improve with usage until fully formatted. Priming, on the other hand, is a conditioning cycle that is applied as a service to improve battery performance during usage or after prolonged storage. Priming relates mainly to nickel-based batteries.

Lead Acid

Formatting a lead acid battery occurs by applying a charge, followed by a discharge and recharge. This is done at the factory and is completed in the field as part of regular use. Experts advise not to strain a new battery by giving it heavy duty discharges at first but gradually working it in with moderate discharges, like an athlete trains for weight lifting or long-distance running. This, however, may not be possible with a starter battery in a vehicle and other uses. Lead acid typically reaches the full capacity potential after 50 to 100 cycles. Figure 1 illustrates the lifespan of lead acid.

cycle-life-lead-acid

Figure 1: Lifespan of Lead Acid
A new lead acid battery may not by fully formatted and only attains full performance after 50 or more cycles. Formatting occurs during use; deliberate cycling is not recommended as this would wear down the battery unnecessarily.

Deep-cycle batteries are at about 85 percent when new and will increase to 100 percent, or close to full capacity, when fully formatted. There are some outliers that are as low as 65 percent when tested with a battery analyzer. The question is asked, “Will these low-performers recover and stand up to their stronger brothers when formatted?” A seasoned battery expert said that “these batteries will improve somewhat but they are the first to fail.”

The function of a starter battery lies in delivering high load currents to crank the engine, and this attribute is present from the beginning without the need to format and prime. To the surprise of many motorists, the capacity of a starter battery can fade to 30 percent and still crank the engine; however, a further drop may get the driver stranded one morning. See also BU-904: How to Measure Capacity)

Nickel-based

Manufacturers advise to trickle charge a nickel-based battery for 16–24 hours when new and after a long storage. This allows the cells to adjust to each other and to bring them to an equal charge level. A slow charge also helps to redistribute the electrolyte to eliminate dry spots on the separator that might have developed by gravitation.

Nickel-based batteries are not always fully formatted when leaving the factory. Applying several charge/discharge cycles through normal use or with a battery analyzer completes the formatting process. The number of cycles required to attain full capacity differs between cell manufacturers. Quality cells perform to specification after 5–7 cycles, while lower-cost alternatives may need 50 or more cycles to reach acceptable capacity levels.

Lack of formatting causes a problem when the user expects a new battery to work at full capacity out of the box. Organizations using batteries for mission-critical applications should verify the performance through a discharge/charge cycle as part of quality control. The “prime” program of automated battery analyzers (Cadex) applies as many cycles as needed to attain full capacity.

Cycling also restores lost capacity when a nickel-based battery has been stored for a few months. Storage time, state-of-charge and temperature under which the battery is stored govern the ease of recovery. The longer the storage and the warmer the temperature, the more cycles will be required to regain full capacity. Battery analyzers help in the priming functions and assure that the desired capacity has been achieved.

Lithium-ion

Some battery users insist that a passivation layer develops on the cathode of a lithium-ion cell after storage. Also known as interfacial protective film (IPF), this layer is said to restrict ion flow, cause an increase in internal resistance and in the worst case, lead to lithium plating. Charging, and more effectively cycling, is known to dissolve the layer and some battery users claim to have gained extra runtime after the second or third cycle on a smartphone, albeit by a small amount.

Scientists do not fully understand the nature of this layer, and the few published resources on this subject only speculate that performance restoration with cycling is connected to the removal of the passivation layer. Some scientists outright deny the existence of the IPF, saying that the idea is highly speculative and inconsistent with existing studies. Whatever the outcome on the passivation of Li-ion may be, there is no parallel to the “memory” effect with NiCd batteries that require periodic cycling to prevent capacity loss. The symptoms may appear similar but the mechanics are different. Nor can the effect be compared to sulfation of lead acid batteries.

A well-known layer that builds up on the anode is the solid electrolyte solid electrolyte interface (SEI). SEI is an electrical insulation but has sufficient ionic conductivity to allow the battery to function normally. While the SEI layer lowers the capacity, it also protects the battery. Without SEI, Li-ion might not get the longevity that it has. (See BU-307: How does Electrolyte Work?)

The SEI layer develops as part of a formation process and manufacturers take great care to do this right, as a batched job can cause permanent capacity loss and a rise in internal resistance. The process includes several cycles, float charges at elevated temperatures and rest periods that can take many weeks to complete. This formation period also provides quality control and assists in cell matching, as well as observing self-discharge by measuring the cell voltage after a rest. High self-discharge hints to impurity as part of a potential manufacturing defect.

Electrolyte oxidation (EO) also occurs on the cathode. This causes a permanent capacity loss and increases the internal resistance. No remedy exists to remove the layer once formed but electrolyte additives lessen the impact. Keeping Li-ion at a voltage above 4.10V/cell while at an elevated temperature promotes electrolyte oxidation. Field observation shows that the combination of heat and high voltage can stress Li-ion more than harsh cycling.

Lithium-ion is a very clean system that does not need additional priming once it leaves the factory, nor does it require the level of maintenance that nickel-based batteries do. Additional formatting makes little difference because the maximum capacity is available right from the beginning, (the exception may be a small capacity gain after a long storage). A full discharge does not improve the capacity once the battery has faded — a low capacity signals the end of life. A discharge/charge may calibrate a “smart” battery but this does little to improve the chemical battery. (See BU-601: Inner Working of a Smart Battery.) Instructions recommending charging a new Li-ion for 8 hours are written off as “old school,” a left-over from the old nickel battery days.

Non-rechargeable Lithium

Primary lithium batteries, such as lithium-thionyl chloride (LTC), benefit from passivation in storage. Passivation is a thin layer that forms as part of a reaction between the electrolyte, the lithium anode and the carbon-based cathode. (Note that the anode of a primary lithium battery is lithium and the cathode is graphite, the reverse of Li-ion.)

Without this layer, most lithium batteries could not function because the lithium would cause a rapid self-discharge and degrade the battery quickly. Battery scientists even say that the battery would explode without the formation of lithium chloride layers and that the passivation layer is responsible for the battery’s existence and the ability to store for 10 years.

Temperature and state-of-charge promote the buildup of the passivation layer. A fully charged LTC is harder to depassivate after long storage than one that was kept at a low charge. While LTC should be stored at cool temperatures, depassivation works better when warm as the increased thermal conductivity and mobility of the ions helps in the process.

CAUTION Do not apply physical tension or excessive heat to the battery. Explosions due to careless handling have caused serious injuries to workers.

The passivation layer causes a voltage delay when first applying a load to the battery, and Figure 2 illustrates the drop and recovery with batteries affected by different passivation levels. Battery A demonstrates a minimal voltage drop while Battery C needs time to recover.

applying_load_passivated_battery

Figure 2: Voltage behavior when applying a load to a passivated battery.
Battery A has mild passivation, B takes longer to restore, and C is affected the most.
Courtesy EE Times

LTC in devices drawing very low current, such as a sensor for a road toll or metering, may develop a passivation layer that can lead to malfunction, and heat promotes such growth. This can often be solved by adding a large capacitor in parallel with the battery. The battery that has developed a high internal resistance is still capable of charging the capacitor to deliver the occasional high pulses; the standby time in between is devoted to recharging the capacitor.

To assist in sulfation prevention during storage, some lithium batteries are shipped with a 36kΩ resistor to serve as a parasitic load. The steady low discharge current prevents the layer from growing too thick, but this will reduce the storage life. After 2-year storage with the 36kΩ resistor, the batteries are said to still have 90 percent capacity. Another remedy is attaching a device that applies periodic discharge pulses during storage.

Not all primary lithium batteries recover when installed in a device and when a load is applied. The current may be too low to reverse the passivation. It is also possible that the equipment rejects a passivated battery as being low state-of-charge or defective. Many of these batteries can be prepared with a battery analyzer (Cadex) by applying a controlled load. The analyzer then verifies proper function before engaging the battery in the field.

The required discharge current for depassivation is a C-rate of 1C to 3C (1 to 3 times of the rated capacity). The cell voltage must recover to 3.2V when applying the load; the service time is typically 20 seconds. The process can be repeated but it should take no longer than 5 minutes. With a load of 1C, the voltage of a correctly functioning cell should stay above 3.0V. A drop to below 2.7V means end-of-life. (See BU-106: Primary Batteries)

These lithium-metal batteries have high lithium content and must follow more stringent shipping requirements than Li-ion of the same Ah. (See BU-704a: Shipping Lithium-based Batteries by air) Because of the high specific energy, special care must be taken in handling these cells.

CAUTION When charging an SLA with over-voltage, current limiting must be applied to protect the battery. Always set the current limit to the lowest practical setting and observe the battery voltage and temperature during charge.

In case of rupture, leaking electrolyte or any other cause of exposure to the electrolyte, flush with water immediately. If eye exposure occurs, flush with water for 15 minutes and consult a physician immediately.
Wear approved gloves when touching the electrolyte, lead and cadmium. On exposure to the skin, flush with water immediately.

Fade-Spare-Actual image(Data trend chart)

Know how to maintain a battery fleet and eliminate the risk of unexpected downtime.

A battery performs well when new but the capacity soon begins to fade with use and time. To assure reliable service during the life span of the battery, design engineers oversize the pack to include some spare capacity. This is similar to carrying extra fuel in an airplane to enable a waiting pattern or attempt a second landing approach when so required.

New batteries operate (should operate) at a capacity of 100 percent; replacement occurs when the packs fade to about 80 percent. All batteries must include a secure level of spare capacity to cover worst-case scenarios.

In addition to normal capacity fade, cold temperature lowers the capacity, especially Li-ion. The capacity loss of a Li-ion Energy Cell is about 17 percent at 0°C (32°F), 34 percent at –10°C (14°F) and 47 percent at –20°C (–4°F). Power Cells perform better at cold temperature with lower cold-related capacity losses than Energy Cells.

Lack of spare capacity is a common cause of system failures. This commonly happens during heavier than normal traffic or in an emergency. During routine operations, marginal batteries can hide comfortably among their peers, but they will fail when put to the test. A battery maintenance program as part of quality control assures that all batteries in the fleet are within the required performance range.

Figure 1 illustrates the breakdown of a battery that includes capacity fade and spare capacity. Adding 20 percent for fade and 20 percent for spare as a safety net leaves only 60 percent for the actual capacity. Such a generous allowance may not be practical in all cases.

Fade-Spare-Actual

Figure 1: Calculating spare battery capacity.
Spare capacity should be calculated for a worst-case scenario. The allowable capacity range is 80-100%; a spare capacity of 20 percent is recommended for critical use. Allow more capacity reserve when operating at cold temperature.

To verify sufficient spare capacity in a battery fleet, identify batteries that are close to retirement and spot-check their capacities after a busy day with a battery analyzer. The Cadex analyzer provides this function on the “Prime” program in that it applies a discharge before charge. The first reading on the display reflects the spare capacity and the second represents the full capacity after a charge.

If packs with fringe capacity levels come back from a full-day shift with less than 10 percent of spare capacity, raise the pass/fail target capacity from 80 to 85 percent to gain five extra points. If, on the other hand, these old-timers come back with 30 percent before charging, keep them longer by lowering the target capacity to, say, 70 percent. Knowing the energy needs for each application during a typical shift increases battery transparency. This improves reliability and creates a sweet spot between risk management and economics.

While most batteries are replaced when the capacity fades to 80 percent, scanners in some warehouses can be kept longer because they may not require all available capacity during an 8-hour shift. If this is the case, the target capacity can safely be set to 70 percent while maintaining ample spare capacity. A starter battery in a vehicle still cranks the motor with a capacity of 40 percent. The discharge is short and the battery recharges right away. Allowing the capacity to drop much further might prevent the battery from turning the engine on a cold morning, stranding the driver.

Himax discharge-voltage-temperature(Data trend chart)

Explore the limitations when operating a battery at adverse temperatures and learn how to minimize the effects.

Like humans, batteries function best at room temperature. Warming a dying battery in a mobile phone or flashlight in our jeans might provide additional runtime due to improved electrochemical reaction. This is likely also the reason why manufacturers prefer to specify batteries at a toasty 27°C (80°F). Operating a battery at elevated temperatures improves performance but prolonged exposure will shorten life.

As all drivers in cold countries know, a warm battery cranks the car engine better than a cold one. Cold temperature increases the internal resistance and lowers the capacity. A battery that provides 100 percent capacity at 27°C (80°F) will typically deliver only 50 percent at –18°C (0°F). The momentary capacity-decrease differs with battery chemistry.

The dry solid polymer battery requires a temperature of 60–100°C (140–212°F) to promote ion flow and become conductive. This type of battery has found a niche market for stationary power applications in hot climates where heat serves as a catalyst rather than a disadvantage. Built-in heating elements keep the battery operational at all times. High battery cost and safety concerns have limited the application of this system. The more common lithium-polymer uses gelled electrolyte to enhance conductivity.

All batteries achieve optimum service life if used at 20°C (68°F) or slightly below. If, for example, a battery operates at 30°C (86°F) instead of a more moderate lower room temperature, the cycle life is reduced by 20 percent. At 40°C (104°F), the loss jumps to a whopping 40 percent, and if charged and discharged at 45°C (113°F), the cycle life is only half of what can be expected if used at 20°C (68°F).
The performance of all batteries drops drastically at low temperatures; however, the elevated internal resistance will cause some warming effect by efficiency loss caused by voltage drop when applying a load current. At –20°C (–4°F) most batteries are at about 50 percent performance level. Although NiCd can go down to –40°C (–40°F), the permissible discharge is only 0.2C (5-hour rate). Specialty Li-ion can operate to a temperature of –40°C but only at a reduced discharge rate; charging at this temperature is out of the question. With lead acid there is the danger of the electrolyte freezing, which can crack the enclosure. Lead acid freezes quicker with a low charge when the specific gravity is more like water than when fully charged.

Figure 1 illustrates the discharge voltage of an 18650 Li-ion under various temperatures. A 3A discharge of a 2.8Ah cell represents a C-rate of 1.07C. The reduced capacity at low temperature only applies while the cell is in that condition and will recover in room temperature.

discharge-voltage-temperature

Figure 1: Discharge voltage of an 18650 Li-ion cell at 3A and various temperatures.
Cell type: Panasonic NRC18650PD, 2.8Ah nominal, LiNiCoAlO2 (NCA)
Source: Technische Universität München (TUM)

Matched cells with identical capacities play an important role when discharging at low temperature and under heavy load. Since the cells in a battery pack can never be perfectly matched, a negative voltage potential can occur across a weaker cell in a multi-cell pack if the discharge is allowed to continue beyond a safe cut-off point. Known as cell reversal, the weak cell gets stressed to the point of developing a permanent electrical short. The larger the cell-count, the greater is the likelihood of cell-reversal under load. Over-discharge at a low temperature and heavy load is a large contributor to battery failure of cordless power tools

The driving range of an electric vehicle between charges is calculated at ambient temperature. EV drivers are being made aware that frigid temperature reduces the available mileage. This loss is not only caused by heating the cabin electrically but by the inherent slowing of the battery’s electrochemical reaction, which reduces the capacity while cold.