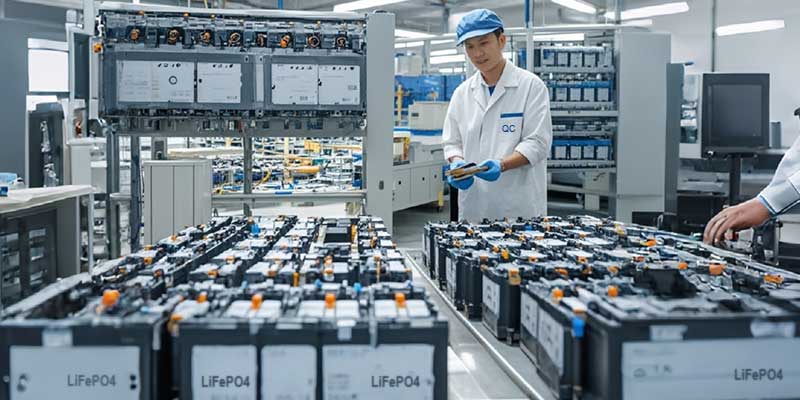
Himax - car charge Decorative pictures

Connect charging behavior to fundamentals in Battery Health

Battery users often ask: “Why does an old Li-ion lake so long to charge?” Indeed, when Li-ion gets older, the battery takes its time to charge even if there is little to fill. We call this the “old-man syndrome.” Figure 1 illustrates the charge time of a new Li-ion with a capacity of 100 percent against an aged pack delivering only 82 percent. Both take roughly 150 minutes to charge.


aged-vs-new-capacity-web
Figure 1: New and aged Li-ion batteries are charged.

Both packs take roughly 150 minutes to charge. The new pack charges to 1,400mAh (100%) while the aged one only goes to 1,150mAh (82%).


When charging Li-ion, the voltage shoots up similar to lifting a weight with a rubber band. The new pack as demonstrated in Figure 2 is “hungrier” and can take on more “food” before reaching the 4.20V/cell voltage limit compared to the aged Li-ion that hits V Limit in Stage 1 after only about 60 minutes. In terms of a rubber band analogy, the new battery has less slack than to the aged pack and can accept charge longer before going into saturation.

aged-vs-new-voltage-web.jpg

Figure 2: Observing charge times of a new and aged Li-ion in Stage 1.

The new Li-ion takes on full charge for 90 minutes while the aged cell reaches 4.20V/cell in 60 minutes、

Figure 3 demonstrates the different saturation times in Stage 2 as the current trails from the fully regulated current to about 0.05C to trigger ready mode. The trailing on a good battery is short and is prolonged on an aged pack. This explains the longer charge time of an older Li-ion with less capacity. An analogy is a young athlete running a sprint with little or no slow-down towards the end, while the old man gets out of breath and begins walking, prolonging the time to reach the goal.

aged-vs-new-current-web.jpg

Figure 3: Observing saturation times of new and aged Li-ion in Stage 2 before switching to ready.

The new cell stays in full-charge longer than the old cell and has a shorter current trail.

A common aging effect of Li-ion is loss of charge transfer capability. This is caused by the formation of passive materials on the electrodes, which inhibits the flow of free electrons. This reduces the porosity on the electrodes, decreases the surface area, lowers the lower ionic conductivity and raises migration resistance. The aging phenomenon is permanent and cannot be reversed.

The health of a battery is based on these three fundamental attributes:

  • Capacity, the ability to store energy. Capacity is the leading health indicator of a battery
  • Internal resistance, the ability to deliver current
  • Self-discharge, indicator of the mechanical integrity

The charge signature reveals valuable health indicators of Li-ion. A good battery absorbs most of the charge in Stage 1 before reaching 4.20V/cell and the trailing in Stage 2 is short. “Lack of hunger” on a Li-ion can be attributed to a battery being partially charged; exceptionally long trailing times relates to a battery with low capacity, high internal resistance and/or elevated self-discharge.

A look at Old and New Battery Packaging (Article illustrations)

Discover familiar battery formats, some of which going back to the late 1800s.

Early batteries of the 1700s and 1800s developed in Europe were mostly encased in glass jars. As batteries grew in size, jars shifted to sealed wooden containers and composite materials. In the 1890s, battery manufacturing spread from Europe to the United States and in 1896 the National Carbon Company successfully produced a standard cell for widespread consumer use. It was the zinc-carbon Columbia Dry Cell Battery producing 1.5 volts and measuring 6 inches in length.

With the move to portability, sealed cylindrical cells emerged that led to standards sizes. The International Electrochemical Commission (IEC), a non-governmental standards organization founded in 1906, developed standards for most rechargeable batteries. In around 1917, the National Institute of Standards and Technology formalized the alphabet nomenclature that is still used today. Table 1 summarizes these historic and current battery sizes.

Size

Dimensions

History

F cell

33 x 91 mm

Introduced in 1896 for lanterns; later used for radios; only available in nickel-cadmium today.

E cell

N/A

Introduced ca. 1905 to power box lanterns and hobby applications. Discontinued ca. 1980.

D cell

34.2 x 61.5mm

Introduced in 1898 for flashlights and radios; still current.
C cell 25.5 x 50mm Introduced ca. 1900 to attain smaller form factor.

Sub-C

22.2 x 42.9mm
16.1mL

Cordless tool battery. Other sizes are ½, 4/5 and 5/4 sub-C lengths. Mostly NiCd.

B cell

20.1 x 56.8mm

Introduced in 1900 for portable lighting, including bicycle lights in Europe; discontinued in in North America in 2001.

A cell

17 x 50mm

Available in NiCd, NiMH and primary lithium; also in 2/3 and 4/5 sizes. Popular in older laptops and hobby applications.

AA cell

14.5 x 50mm

Introduced in 1907 as penlight battery for pocket lights and spy tool in WWI; added to ANSI standard in 1947.

AAA cell

10.5 x 44.5mm

Developed in 1954 to reduce size for Kodak and Polaroid cameras. Added to ANSI standard in 1959.

AAAA cell

8.3 x 42.5mm

Offshoot of 9V, since 1990s; used for laser pointers, LED penlights, computer styli, headphone amplifiers.

4.5V battery

67 x 62
x 22mm

Three cells form a flat pack; short terminal strip is positive, long strip is negative; common in Europe, Russia.

9V battery

48.5 x 26.5
x 17.5mm

Introduced in 1956 for transistor radios; contains six prismatic or AAAA cells. Added to ANSI standard in 1959.

18650

18 x 65mm
16.5mL

Developed in the mid-1990s for lithium-ion; commonly used in laptops, e-bikes, including Tesla EV cars.

26650

26 x 65mm
34.5mL

Larger Li-ion. Some measure 26x70mm sold as 26700. Common chemistry is LiFeO4 for UPS, hobby, automotive.

14500

14x 50mm

Li-ion, similar size to AA. (Observe voltage incompatibility: NiCd/NiMH = 1.2V, alkaline = 1.5V, Li-ion = 3.6V)
21700* 21 x 70mm New (2016), used for the Tesla Model 3 and other applications, made by Panasonic, Samsung, Molicel, etc.
32650 32 x 65mm Primarily in LiFePO4 (Lithium Iron Phosphate)

Table 1: Common old and new battery norms.
* The 21700 cell is also known as 2170. IEC norm calls for the second zero at the end to denote cylindrical format.

Standardization included primary cells, mostly in zinc-carbon; alkaline emerged only in the early 1960s. With the growing popularity of the sealed nickel-cadmium in the 1950s and 1960s, new sizes appeared, many of which were derived from the “A” and “C” sizes. Beginning in the 1990s, makers of Li-ion departed from conventional sizes and invented their own standards.

A successful standard is the 18650 cylindrical cell. Developed in the early 1990s for lithium-ion, these cells are used in laptops, electric bicycles and even electric vehicles (Tesla). The first two digits of 18650 designate the diameter in millimeters; the next three digits are the length in tenths of millimeters. The 18650 cell is 18mm in diameter and 65.0mm in length.

Other sizes are identified with a similar numbering scheme. For example, a prismatic cell carries the number 564656P. It is 5.6mm thick, 46mm wide and 56mm long. P stands for prismatic. Because of the large variety of chemistries and their diversity within, battery cells do not show the chemistry.

Few popular new standards have immerged since the 18650 appeared in ca. 1991. Several battery manufacturers started experimenting using slightly larger diameters with sizes of 20x70mm, 21x70mm and 22x70mm. Panasonic and Tesla decided on the 21×70, so has Samsung, and other manufacturers followed. The “2170” is only slightly larger than the 18650 it but has 35% more energy (by volume). This new cell is used in the Tesla Model 3 while Samsung is looking at new applications in laptops, power tools, e-bikes and more. It is said that the best diameters in terms of manufacturability is between 18mm and 26mm and the 2170 sits in between. (The 2170 is also known as the 21700.) The 26650 introduced earlier never became a best-seller.

The 32650 is primarily available in LiFePO4 (Lithium Iron Phosphate) with a nominal voltage of 3.2V/cell and a typical capacity of 5,000mAh. The dimensions are 32x65mm; true sizes may be slightly larger to allow for insulation and labels.

On the prismatic and pouch cell front, new cells are being developed for the electric vehicle (EV) and energy storage systems (ESS). Some of these formats may one day also become readily available similar to the 18650, made in high energy and high power versions, sourced by several manufacturers and sold at a competitive prices. Prismatic and pouch cells currently carry a higher price tag per Wh than the 18650.

The EV and ESS markets advance with two distinct philosophies: The use of a large number of small cells produced by an automated process as low cost, as done by Tesla, versus larger cells in the prismatic and pouch formats at a higher price per Wh for now, as done by other EV manufacturers. We have not seen clear winners of either format; time will tell.

Looking at the batteries in mobile phones and laptops, one sees a departure from established standards. This is due in part to the manufacturers’ inability to agree on a standard, meaning that most consumer devices come with custom-made cells or battery packs. Compact design and market demand are swaying manufacturers to go their own way. High volume with planned obsolescence allows the production of unique sizes in consumer products.

In the early days, a battery was perceived “big” by nature, and this is reflected in the sizing convention. While the “F” nomenclature may have been seen as mid-sized in the late 1800s, our forefathers did not anticipate that a battery resembling a credit card could power computers, phones and cameras. Running out of letters towards the smaller sizes led to the awkward numbering of AA, AAA and AAAA.

Since the introduction of the 9V battery in 1956, no new formats have emerged. Meanwhile portable devices lowered the operating voltages to between 3V and 5V. Switching six cells (6S) in series to attain 9V is expensive to manufacture, and a 3.6V alternative would serve better. This imaginary new pack would have a coding system to prevent charging primaries and select the correct charge algorithm for secondary chemistries.

Starter batteries for vehicles also follow battery norms that are based on the North American BCI, the European DIN and the Japanese JIS standards. These batteries are similar in footprint to allow swapping. Deep-cycle and stationary batteries follow no standardized norms and the replacement packs must be sourced from the original maker. The attempt to standardize electric vehicle batteries may not work and might follow the failed attempt to standardize laptop batteries in the 1990s.

Future Cell Formats

Standardization for Li-ion cell formats is diverse, especially for the electric vehicle. Research teams, including Fraunhofer,* examine and evaluate various formats and the most promising cell types until 2025 will be the pouch and the 21700 cylindrical formats. Looking further, experts predict the large-size prismatic Li-ion cell to domineer in the EV battery market. Meanwhile, Samsung and others bet on the prismatic cell, LG gravitates towards the pouch format and Panasonic is most comfortable with the 18650 and 21700 cylindrical cells.

Large battery systems for ESS, UPS, marine vessels and traction use mostly large format pouch cells stacked with light pressure to prolong longevity and prevent delamination. Thermal management is often done by plates drawing the heat between layers to the outside and liquid cooling.

Safety Concerns with Rechargeable Cells

Off-the-shelf cells have primarily been non-rechargeable and for public use. Typical applications are spares for flashlights, portable entertainment devices and remote controls. Accidental shorting with keys or coins in a jean pocket only causes an alkaline cell to heat up and not catch fire. The voltage collapses on an electrical short because of high internal resistance; removing the short stops the reaction. (See BU-304c: Battery Safety in Public.)

Rechargeable cells are normally encapsulated in a for-purpose pack. The exception is the 18650 available as a spare cell for vaping. Looking like a large AA cell, these Li-ion cells can inflict acute injury, even death, if mishandled. If shorted, an unprotected Li-ion cell will vent with flame. Once the jet-like explosion is in progress, removing the short no longer stops the reaction and the cell burns out. Li-ion’s ability to deliver high power is a characteristic that must be respected. (See also BU-304c: Battery Safety in Public.)

The 18650 cell can be made safe with built-in safety circuits described in BU-304b: Making Lithium-ion Safe. With protection, excessive current shuts the cell down, either momentarily by a heat element or permanently by an electric fuse. But the fused 18650 has the disadvantage of shutting down when high current is needed on purpose, such as vaping. Spare cells for vaping are normally unprotected.

Another cause of fire is low quality no-brand cells. Li-ion batteries are safe if made by a reputable manufacturer. Many aftermarket cells do not have the same rigorous safety checks as brand name products have. (See BU-810: What Everyone Should Know About Aftermarket Batteries.) Cells can also be damaged by stress related to heat, shock, vibration and incorrect charging or loading.

Future Batteries(Article illustrations)

Most future batteries function wonderfully in a theoretical world, but many fail to meet the eight basic requirement of the so-called Octagon Battery. Short cycle life and limited load currents often prevent commercialization of the breakthroughs. While futuristic batteries may find a niche market, many never step outside the lab and see the light of day, not to mention advance to power the electric powertrain. This touches with emotions and is as far as the battery can go.

Chemistry Lithium-air Lithium-metal Solid-state Lithium Lithium-sulfur
Li-S
Sodium-iron
Na-ion
Type Air cathode with lithium anode Lithium anode; graphite cathode Lithium anode; polymer separator Lithium anode; sulfur cathode Carbon anode; diverse cathodes
Voltage per cell 1.70–3.20V 3.60V 3.60V 2.10V 3.6V
Specific Energy 13kWh/kg theoretical) 300Wh/kg 300Wh/kg (est.) 500Wh/kg or less 90Wh/kg
Charging Unknown Rapid charge Rapid charge 0.2C (5h) Unknown
Discharging Low power; inferior when cold High power band Poor conductivity when cold High power (2,500W/kg) Unknown
Cycle life 50 cycles in labs 2,500 100, prototypes 50, disputed 50 typical
Packaging Not defined Not defined Prismatic Not defined Not defined
Safety Unknown Needs improvement Needs improvement Protection circuit required Safe; shipment by air possible
History Started in 1970s; renewed interest in the 2000s. R&D by IBM MIT, UC, etc. Produced in the 1980s by Moli Energy; caused safety recall Similar to Li-polymer that started in 1970 New technology; R&D by Oxis Energy, Bosch and others. Ignored in the 1980s in favor
of lithium; has renewed interest
Failure modes Lithium peroxide film stops electron movement with use. Air impurity causes damage. Dendrite growth causes electric short with usage Dendrite growth causes electric short; poor low temperature. performance Sulfur degrades with cycling; unstable when hot, poor conductivity Little research in this area
Applications Not defined; potential for EV EV, industrial and portable uses EES, wheeled mobility; also talk about EV Solar-powered airplane flight in August 2008 Energy storage
Comments Borrowed from “breathing” zinc-air and fuel cell concept Good capacity, fast charge and high power keep interest high Similar to lithium-metal; may be ready by 2020; EVs in 2025 May succeed Li-ion due to lower cost and higher capacity Low cost in par with lead acid. Can be fully discharged.

Table 1: Summary of most common future batteries. Readings are estimated and may vary with different versions and newer developments. More information on BU-212: Future Batteries. Readings are estimated and may vary with newest development.

Charging at High and Low Temperatures(Article illustrations)

Learn how to extend battery life by moderating ambient temperatures.

Batteries operate over a wide temperature range, but this does not give permission to also charge them at these conditions. The charging process is more delicate than discharging and special care must be taken. Extreme cold and high heat reduce charge acceptance, so the battery must be brought to a moderate temperature before charging.

Older battery technologies, such as lead acid and NiCd, have higher charging tolerances than newer systems. This allows them to charge below freezing but at a reduced charge C-rate. When it comes to cold-charging NiCd is hardier than NiMH.

Table 1 summarizes the permissible charge and discharge temperatures of common rechargeable batteries. The table excludes specialty batteries that are designed to charge outside these parameters.

Battery type

Charge temperature

Discharge temperature

Charge advisory

Lead acid

–20°C to 50°C
(–4°F to 122°F)
–20°C to 50°C
(–4°F to 122°F)
Charge at 0.3C or lessbelow freezing.
Lower V-threshold by 3mV/°C when hot.

NiCd, NiMH

0°C to 45°C
(32°F to 113°F)
–20°C to 65°C
(–4°F to 149°F)
Charge at 0.1C between –18°C and 0°C.

Charge at 0.3C between 0°C and 5°C.
Charge acceptance at 45°C is 70%. Charge acceptance at 60°C is 45%.

Li-ion

0°C to 45°C
(32°F to 113°F)
–20°C to 60°C
(–4°F to 140°F)
No charge permitted below freezing.
Good charge/discharge performance at higher temperature but shorter life.

Table 1: Permissible temperature limits for various batteries. Batteries can be discharged over a large temperature range, but the charge temperature is limited. For best results, charge between 10°C and 30°C (50°F and 86°F). Lower the charge current when cold.

Low-temperature Charge

Fast charging of most batteries is limited to 5°C to 45°C (41°F to 113°F); for best results consider narrowing the temperature bandwidth to between 10°C and 30°C (50°F and 86°F) as the ability to recombine oxygen and hydrogen diminishes when charging nickel-based batteries below 5°C (41°F). If charged too quickly, pressure builds up in the cell that can lead to venting. Reduce the charge current of all nickel-based batteries to 0.1C when charging below freezing.

Nickel-based chargers with NDV full-charge detection offer some protection when fast charging at low temperatures; the poor charge acceptance when cold mimics a fully charged battery. This is in part caused by a high pressure buildup due to the reduced ability to recombine gases at low temperature. Pressure rise and a voltage drop at full charge appear synonymous.

To enable fast charging at all temperatures, some industrial batteries add a thermal blanket that heats the battery to an acceptable temperature; other chargers adjust the charge rate to prevailing temperatures. Consumer chargers do not have these provisions and the end user is advised to only charge at room temperature.

Lead acid is reasonably forgiving when it comes to temperature extremes, as the starter batteries in our cars reveal. Part of this tolerance is credited to their sluggish behavior. The recommended charge rate at low temperature is 0.3C, which is almost identical to normal conditions. At a comfortable temperature of 20°C (68°F), gassing starts at charge voltage of 2.415V/cell. When going to –20°C (0°F), the gassing threshold rises to 2.97V/cell.

A lead acid battery charges at a constant current to a set voltage that is typically 2.40V/cell at ambient temperature. This voltage is governed by temperature and is set higher when cold and lower when warm. Figure 2 illustrates the recommended settings for most lead acid batteries. In parallel, the figure also shows the recommended float charge voltage to which the charger reverts when the battery is fully charged. When charging lead acid at fluctuating temperatures, the charger should feature voltage adjustment to minimize stress on the battery. (See also BU-403: Charging Lead Acid.)

Voltage vs Temperature

Figure 2: Cell voltages on charge and float at various temperatures.
Charging at cold and hot temperatures requires adjustment of voltage limit.
Source: Betta Batteries

Freezing a lead acid battery leads to permanent damage. Always keep the batteries fully charged because in the discharged state the electrolyte becomes more water-like and freezes earlier than when fully charged. According to BCI, a specific gravity of 1.15 has a freezing temperature of –15°C (5°F). This compares to –55°C (–67°F) for a specific gravity of 1.265 with a fully charged starter battery. Flooded lead acid batteries tend to crack the case and cause leakage if frozen; sealed lead acid packs lose potency and only deliver a few cycles before they fade and need replacement.

Li ion can be fast charged from 5°C to 45°C (41 to 113°F). Below 5°C, the charge current should be reduced, and no charging is permitted at freezing temperatures because of the reduced diffusion rates on the anode. During charge, the internal cell resistance causes a slight temperature rise that compensates for some of the cold. The internal resistance of all batteries rises when cold, prolonging charge times noticeably.

Many battery users are unaware that consumer-grade lithium-ion batteries cannot be charged below 0°C (32°F). Although the pack appears to be charging normally, plating of metallic lithium can occur on the anode during a sub-freezing charge. This is permanent and cannot be removed with cycling. Batteries with lithium plating are more vulnerable to failure if exposed to vibration or other stressful conditions. Advanced chargers (Cadex) prevent charging Li-ion below freezing.

Advancements are being made to charge Li-ion below freezing temperatures. Charging is indeed possible with most lithium-ion cells but only at very low currents. According to research papers, the allowable charge rate at –30°C (–22°F) is 0.02C. At this low current, the charge time would stretch to over 50 hours, a time that is deemed impractical. There are, however, specialty Li-ions that can charge down to –10°C (14°F) at a reduced rate.

High-temperature Charge

Heat is the worst enemy of batteries, including lead acid. Adding temperature compensation on a lead acid charger to adjust for temperature variations is said to prolong battery life by up to 15 percent. The recommended compensation is a 3mV drop per cell for every degree Celsius rise in temperature. If the float voltage is set to 2.30V/cell at 25°C (77°F), the voltage should read 2.27V/cell at 35°C (95°F). Going colder, the voltage should be 2.33V/cell at 15°C (59°F). These 10°C adjustments represent 30mV change.

Table 3 indicates the optimal peak voltage at various temperatures when charging lead acid batteries. The table also includes the recommended float voltage while in standby mode.

BATTERY STATUS -40°C (-40°F) -20°C (-4°F) 0°C (32°F) 25°C (77°F) 40°C (104°F)
Voltage limit
on recharge
2.85V/cell 2.70V/cell 2.55V/cell 2.45V/cell 2.35V/cell
Float voltage
at full charge
2.55V/cell
or lower
2.45V/cell
or lower
2.35V/cell
or lower
2.30V/cell
or lower
2.25V/cell
or lower

Table 3: Recommended voltage limits when charging and maintaining stationary lead acid batteries on float charge. Voltage compensation prolongs battery life when operating at temperature extremes.

Charging nickel-based batteries at high temperatures lowers oxygen generation, which reduces charge acceptance. Heat fools the charger into thinking that the battery is fully charged when it’s not.

Charging nickel-based batteries when warm lowers oxygen generation that reduces charge acceptance. Heat fools the charger into thinking that the battery is fully charged when it’s not. Figure 4 shows a strong decrease in charge efficiency from the “100 percent efficiency line” when dwelling above 30°C (86°F). At 45°C (113°F), the battery can only accept 70 percent of its full capacity; at 60°C (140°F) the charge acceptance is reduced to 45 percent. NDV for full-charge detection becomes unreliable at higher temperatures, and temperature sensing is essential for backup.

NiCd charge acceptance as a function of temperature.

Figure 4: NiCd charge acceptance as a function of temperature. High temperature reduces charge acceptance and departs from the dotted “100% efficiency line.” At 55°C, commercial NiMH has a charge efficiency of 35–40%; newer industrial NiMH attains 75–80%.
Courtesy of Cadex

Lithium-ion performs well at elevated temperatures but prolonged exposure to heat reduces longevity. Charging and discharging at elevated temperatures is subject to gas generation that might cause a cylindrical cell to vent and a pouch cell to swell. Many chargers prohibit charging above 50°C (122°F).

Some lithium-based packs are momentarily heated to high temperatures. This applies to batteries in surgical tools that are sterilized at 137°C (280°F) for up to 20 minutes as part of autoclaving. Oil and gas drilling as part of fracking also exposes the battery to high temperatures.

Capacity loss at elevated temperature is in direct relationship with state-of-charge (SoC). Figure 5 illustrates the effect of Li-cobalt (LiCoO2) that is first cycled at room temperature (RT) and then heated to 130°C (266°F) for 90 minutes and cycled at 20, 50 and 100 percent SoC. There is no noticeable capacity loss at room temperature. At 130°C with a 20 percent SoC, a slight capacity loss is visible over 10 cycles. This loss is higher with a 50 percent SoC and shows a devastating effect when cycled at full charge.

Capacity loss
Figure 5: Capacity loss at room temperature (RT) and 130°C for 90 minutes
Sterilization of batteries for surgical power tools should be done at low SoC.

Test: LiCoO2/Graphite cells were exposed to 130°C for 90 min.at different SoC between each cycle.
Source: Greatbatch Medical

Caution: In case of rupture, leaking electrolyte or any other cause of exposure to the electrolyte, flush with water immediately. If eye exposure occurs, flush with water for 15 minutes and consult a physician immediately.
Himax - Battery Charger(Article illustrations)

Discover which charger is best for your application

A good battery charger provides the base for batteries that are durable and perform well. In a price-sensitive market, chargers often receive low priority and get the “after-thought” status. Battery and charger must go together like a horse and carriage. Prudent planning gives the power source top priority by placing it at the beginning of the project rather than after the hardware is completed, as is a common practice. Engineers are often unaware of the complexity involving the power source, especially when charging under adverse conditions.

Battery Charger Figure 1: Battery and charger must go together like horse and carriage.
One does not deliver without the other.

Chargers are commonly identified by their charging speed. Consumer products come with a low-cost personal charger that performs well when used as directed. The industrial charger is often made by a third party and includes special features, such as charging at adverse temperatures. Although batteries operate below freezing, not all chemistries can be charged when cold and most Li-ions fall into this category. Lead- and nickel-based batteries accept charge when cold but at a lower rate. (See BU-410: Charging at High and Low Temperature)

Some Li-ion chargers (Cadex) include a wake-up feature, or “boost,” to allow recharging if a Li-ion battery has fallen asleep due to over-discharge. A sleep condition can occur when storing the battery in a discharged state in which self-discharge brings the voltage to the cut-off point. A regular charger treats such a battery as unserviceable and the pack is often discarded. Boost applies a small charge current to raise the voltage to between 2.2V/cell and 2.9V/cell to activate the protection circuit, at which point a normal charge commences. Caution is required if a Li-ion has dwelled below 1.5V/cell for a week or longer. Dendrites may have developed that could compromise safety. (See BU-802b: What does Elevated Self-discharge Do? in which Figures 5 examines the elevated self-discharge after a Li-ion cell had been exposed to deep discharge. See also BU-808a: How to Awaken Sleeping Li-ion.)

Lead- and lithium-based chargers operate on constant current constant voltage (CCCV). The charge current is constant and the voltage is capped when it reaches a set limit. Reaching the voltage limit, the battery saturates; the current drops until the battery can no longer accept further charge and the fast charge terminates. Each battery has its own low-current threshold.

Nickel-based batteries charge with constant current and the voltage is allowed to rise freely. This can be compared to lifting a weight with a rubber band where the hand advances higher than the load. Full charge detection occurs when observing a slight voltage drop after a steady rise. To safeguard against anomalies, such as shorted or mismatched cells, the charger should include a plateau timer to assure a safe charge termination if no voltage delta is detected. Temperature sensing should also be added that measures temperature rise over time. Such a method is known as delta temperature over delta time, or dT/dt, and works well with rapid and fast charge.

A temperature rise is normal with nickel-based batteries, especially when reaching the 70 percent charge level. A decrease in charge efficiency causes this, and the charge current should be lowered to limit stress. When “ready,” the charger switches to trickle charge and the battery must cool down. If the temperature stays above ambient, then the charger is not performing correctly and the battery should be removed because the trickle charge could be too high.

NiCd and NiMH should not be left in the charger unattended for weeks and months. Until required, store the batteries in a cool place and apply a charge before use.

Lithium-based batteries should always stay cool on charge. Discontinue the use of a battery or charger if the temperature rises more than 10ºC (18ºF) above ambient under a normal charge. Li ion cannot absorb over-charge and does not receive trickle charge when full. It is not necessary to remove Li-ion from the charger; however, if not used for a week or more, it is best to place the pack in a cool place and recharge before use.

Types of Chargers

The most basic charger was the overnight charger, also known as a slow charger. This goes back to the old nickel-cadmium days where a simple charger applied a fixed charge of about 0.1C (one-tenth of the rated capacity) as long as the battery was connected. Slow chargers have no full-charge detection; the charge stays engaged and a full charge of an empty battery takes 14–16 hours. When fully charged, the slow charger keeps NiCd lukewarm to the touch. Because of its reduced ability to absorb over-charge, NiMH should not be charged on a slow charger. Low-cost consumer chargers charging AAA, AA and C cells often deploy this charge method, so do some children’s toys. Remove the batteries when warm.

The rapid charger falls between the slow and fast charger and is used in consumer products. The charge time of an empty pack is 3–6 hours. When full, the charger switches to “ready.” Most rapid chargers include temperature sensing to safely charge a faulty battery.

The fast charger offers several advantages and the obvious one is shorter charge times. This demands tighter communication between the charger and battery. At a charge rate of 1C, (see BU-402:What is C-rate?) which a fast charger typically uses, an empty NiCd and NiMH charges in a little more than an hour. As the battery approaches full charge, some nickel-based chargers reduce the current to adjust to the lower charge acceptance. The fully charged battery switches the charger to trickle charge, also known as maintenance charge. Most of today’s nickel-based chargers have a reduced trickle charge to also accommodate NiMH.

Li-ion has minimal losses during charge and the coulombic efficiency is better than 99 percent. At 1C, the battery charges to 70 percent state-of-charge (SoC) in less than an hour; the extra time is devoted to the saturation charge. Li-ion does not require the saturation charge as lead acid does; in fact it is better not to fully charge Li-ion — the batteries will last longer but the runtime will be a little less. Of all chargers, Li-ion is the simplest. No trickery applies that promises to improve battery performance as is often claimed by makers of chargers for lead- and nickel-based batteries. Only the rudimentary CCCV method works.

Lead acid cannot be fast charged and the term “fast-charge” is a misnomer. Most lead acid chargers charge the battery in 14–16 hours; anything slower is a compromise. Lead acid can be charged to 70 percent in about 8 hours; the all-important saturation charge takes up the remaining time. A partial charge is fine provided the lead acid occasionally receives a fully saturated charge to prevent sulfation.

The standby current on a charger should be low to save energy. Energy Star assigns five stars to mobile phone chargers and other small chargers drawing 30mW or less on standby. Four stars go to chargers with 30–150mW, three stars to 150–250mW and two stars to 250–350mW. The average consumption is 300mW and these units get one star. Energy Star aims to reduce current consumption of personal chargers that are mostly left plugged in when not in use. There are over one billion such chargers connected to the gird globally at any given time.

Simple Guidelines when Buying a Charger

  • Charging a battery is most effective when its state-of-charge (SoC) is low. Charge acceptance decreases when the battery reaches a SoC of 70% and higher. A fully charged battery can no longer convert electric energy into chemical energy and charge must be lowered to trickle or terminated.
  • Filling a battery beyond full state-of-charge turns excess energy into heat and gas. With Li-ion, this can result in a deposit of unwanted materials. Prolonged over-charge causes permanent damage.
  • Use the correct charger for the intended battery chemistry. Most chargers serve one chemistry only. Make sure that the battery voltage agrees with the charger. Do not charge if different.
  • The Ah rating of a battery can be marginally different than specified. Charging a larger battery will take a bit longer than a smaller pack and vice versa. Do not charge if the Ah rating deviates too much (more than 25 percent).
  • A high-wattage charger shortens the charge time but there are limitations as to how fast a battery can be charged. Ultra-fast charging causes stress.
  • A lead acid charger should switch to float charge when fully saturated; a nickel-based charger must switch to trickle charge when full. Li-ion cannot absorb overcharge and receives no trickle charge. Trickle charge and float charges compensate for the losses incurred by self-discharge.
  • Chargers should have a temperature override to end charge on a faulty battery.
  • Observe charge temperature. Lead acid batteries should stay lukewarm to the touch; nickel-based batteries will get warm towards the end of charge but must cool down on “ready.” Li-ion should not rise more than 10ºC (18ºF) above ambient when reaching full charge.
  • Check battery temperature when using a low-cost charger. Remove battery when warm.
  • Charge at room temperature. Charge acceptance drops when cold. Li-ion cannot be charged below freezing.
NI-MH-Battery-Pack

Nickel-based batteries dwell between lead acid and Li-ion.

They are safe, economical and long-living but are increasingly being assigned to niche markets. Table 1 summarizes the characteristics of present, past and future nickel-based batteries.

Chemistry Nickel-cadmium Nickel-metal-hydride Nickel-iron Nickel-zinc Nickel-hydrogen
Abbreviation NiCd NiMH NiFe NiZn NiH
Type Nickel cathode;
cadmium anode
Nickel cathode;
hydrogen-absorbing anode
Oxide-hydroxide cathode; iron anode with potassium hydroxide electrolyte Similar to NiCd; uses alkaline electrolyte and nickel electrode Nickel electrodes, hydrogen electrodes, in pressurized vessel
Nominal voltage 1.20V/cell (1.25) 1.20V 1.65V 1.25V
Charge Taper charger. Constant current; floating voltage Taper charger, similar to NiCd Taper charger, similar to NiCd Not defined
Full charge Observing voltage drop; plateau voltage as override 1.9V Not defined
Trickle charge 0.1C 0.05C Not defined No trickle charge Not defined
Specific Energy 45–80Wh/kg 60–120Wh/kg 50Wh/kg 100Wh/kg 40–75Wh/kg
Charge rate Can be above 1C 0.5–1C Not defined Regular charge Not defined
Discharge rate Can be above 1C 1C Moderate Relative high power Not defined
Cycle life
(full DoD)
1,000 300–500 20 years in UPS 200–300 Very long cycle life (>70,000 partial)
Maintenance Full discharge every 3 months (memory) Full discharge every 6 months Not defined Not defined Maintenance free; low self-discharge
Failure modes Memory reduces capacity, reversible Memory (less affected than NiCd) Overcharge causes dry-out Short cycle life due to dendrite growth Minimal corrosion
Packaging A, AA, C, also in fractional sizes A, AA, AAA, C, prismatic Not defined AA and others Custom made; each cell costs >$1,000
Environment Broad temperature range. Toxic Considered non-toxic Poor performance when cold Good temperature range Operates at
–28°C to 54°C
History 1899, sealed version made commercial in 1947 Research started in 1967, commercial in the 1980s; derived from nickel-hydrogen In 1901,Thomas Edison patented and promoted NiFe in lieu of lead acid; failed to catch on for ICE, EV In 1901, Thomas Edison was awarded the U.S. patent for the NiZn battery Problems with instabilities in 1967 caused a shift from NiMH to NiH
Applications Main battery in aircraft (flooded), wide temperature range Hybrid cars, consumer, UPS German V-1 flying bombs, V-2 rockets; railroad signaling, UPS, mining Renewed interest to commercial market with Improvements Exclusively satellites; too expensive for terrestrial use
Comments Robust, forgiving, high maintenance. Only battery that can be ultrafast charged with little stress More delicate than NiCd; has higher capacity; less maintenance In 1990, Cd was substituted with Fe to save money. High self-discharge and high fabrication costs High power, good temperature range, low cost but high self-discharge and short service life Uses a steel canister to store hydrogen at 8,270kPa (1,200psi)

Table 1: Summary of most common nickel-based batteries.

Experimental and less common versions are not listed. All readings are estimated average at time of publication. Detailed information is on BU-203: Nickel-based Batteries.

How does the Lead Acid Battery Work?(cover)

Learn about the differences within the lead acid family and find out what the cons and pros are.

Invented by the French physician Gaston Planté in 1859, lead acid was the first rechargeable battery for commercial use. Despite its advanced age, the lead chemistry continues to be in wide use today. There are good reasons for its popularity; lead acid is dependable and inexpensive on a cost-per-watt base. There are few other batteries that deliver bulk power as cheaply as lead acid, and this makes the battery cost-effective for automobiles, golf cars, forklifts, marine and uninterruptible power supplies (UPS).

The grid structure of the lead acid battery is made from a lead alloy. Pure lead is too soft and would not support itself, so small quantities of other metals are added to get the mechanical strength and improve electrical properties. The most common additives are antimony, calcium, tin and selenium. These batteries are often known as “lead-antimony” and “lead­calcium.”

Adding antimony and tin improves deep cycling but this increases water consumption and escalates the need to equalize. Calcium reduces self-discharge, but the positive lead-calcium plate has the side effect of growing due to grid oxidation when being over-charged. Modern lead acid batteries also make use of doping agents such as selenium, cadmium, tin and arsenic to lower the antimony and calcium content.

Lead acid is heavy and is less durable than nickel- and lithium-based systems when deep cycled. A full discharge causes strain and each discharge/charge cycle permanently robs the battery of a small amount of capacity. This loss is small while the battery is in good operating condition, but the fading increases once the performance drops to half the nominal capacity. This wear-down characteristic applies to all batteries in various degrees.

Depending on the depth of discharge, lead acid for deep-cycle applications provides 200 to 300 discharge/charge cycles. The primary reasons for its relatively short cycle life are grid corrosion on the positive electrode, depletion of the active material and expansion of the positive plates. This aging phenomenon is accelerated at elevated operating temperatures and when drawing high discharge currents. (See BU-804:How to Prolong Lead Acid Batteries)

Charging a lead acid battery is simple, but the correct voltage limits must be observed. Choosing a low voltage limit shelters the battery, but this produces poor performance and causes a buildup of sulfation on the negative plate. A high voltage limit improves performance but forms grid corrosion on the positive plate. While sulfation can be reversed if serviced in time, corrosion is permanent. (See BU-403: Charging Lead Acid.)

Lead acid does not lend itself to fast charging and with most types, a full charge takes 14–16 hours. The battery must always be stored at full state-of-charge. Low charge causes sulfation, a condition that robs the battery of performance. Adding carbon on the negative electrode reduces this problem but this lowers the specific energy. ( See BU-202: New Lead Acid Systems. )

Lead acid has a moderate life span, but it is not subject to memory as nickel-based systems are, and the charge retention is best among rechargeable batteries. While NiCd loses approximately 40 percent of their stored energy in three months, lead acid self-discharges the same amount in one year. The lead acid battery works well at cold temperatures and is superior to lithium-ion when operating in subzero conditions. According to RWTH, Aachen, Germany (2018), the cost of the flooded lead acid is about $150 per kWh, one of the lowest in batteries.

Sealed Lead Acid

The first sealed, or maintenance-free, lead acid emerged in the mid-1970s. Engineers argued that the term “sealed lead acid” was a misnomer because no lead acid battery can be totally sealed. To control venting during stressful charge and rapid discharge, valves have been added that release gases if pressure builds up. Rather than submerging the plates in a liquid, the electrolyte is impregnated into a moistened separator, a design that resembles nickel- and lithium-based systems. This enables operating the battery in any physical orientation without leakage.

The sealed battery contains less electrolyte than the flooded type, hence the term “acid-starved.” Perhaps the most significant advantage of sealed lead acid is the ability to combine oxygen and hydrogen to create water and prevent dry out during cycling. The recombination occurs at a moderate pressure of 0.14 bar (2psi). The valve serves as a safety vent if the gas buildup rises. Repeated venting should be avoided as this will lead to an eventual dry-out. According to RWTH, Aachen, Germany (2018), the cost of VRLA is about $260 per kWh.

Several types of sealed lead acid have emerged and the most common are gel, also known as valve-regulated lead acid (VRLA), and absorbent glass mat (AGM). The gel cell contains a silica type gel that suspends the electrolyte in a paste. Smaller packs with capacities of up to 30Ah are often called SLA (sealed lead acid). Packaged in a plastic container, these batteries are used for small UPS, emergency lighting and wheelchairs. Because of low price, dependable service and low maintenance, the SLA remains the preferred choice for healthcare in hospitals and retirement homes. The larger VRLA is used as power backup for cellular repeater towers, Internet hubs, banks, hospitals, airports and more.

The AGM suspends the electrolyte in a specially designed glass mat. This offers several advantages to lead acid systems, including faster charging and instant high load currents on demand. AGM works best as a mid-range battery with capacities of 30 to 100Ah and is less suited for large systems, such as UPS. Typical uses are starter batteries for motorcycles, start-stop function for micro-hybrid cars, as well as marine and RV that need some cycling.

With cycling and age, the capacity of AGM fades gradually; gel, on the other hand, has a dome shaped performance curve and stays in the high performance range longer but then drops suddenly towards the end of life. AGM is more expensive than flooded, but is cheaper than gel. (Gel would be too expensive for start/stop use in cars.)

Unlike the flooded, the sealed lead acid battery is designed with a low over-voltage potential to prohibit the battery from reaching its gas-generating potential during charge. Excess charging causes gassing, venting and subsequent water depletion and dry-out. Consequently, gel, and in part also AGM, cannot be charged to their full potential and the charge voltage limit must be set lower than that of a flooded. This also applies to the float charge on full charge. In respect to charging, the gel and AGM are no direct replacements for the flooded type. If no designated charger is available for AGM with lower voltage settings, disconnect the charger after 24 hours of charge. This prevents gassing due to a float voltage that is set too high. ( See BU-403: Charging Lead Acid )

The optimum operating temperature for a VRLA battery is 25°C (77°F); every 8°C (15°F) rise above this temperature threshold cuts battery life in half. ( See BU-806a: How Heat and Loading affect Battery Life ) Lead acid batteries are rated at a 5-hour (0.2C) and 20-hour (0.05C) discharge rate. The battery performs best when discharged slowly; the capacity readings are substantially higher at a slower discharge than at the 1C-rate. Lead acid can, however, deliver high pulse currents of several C if done for only a few seconds. This makes the lead acid well suited as a starter battery, also known as starter-light-ignition (SLI). The high lead content and the sulfuric acid make lead acid environmentally unfriendly.

Lead acid batteries are commonly classified into three usages: Automotive (starter or SLI), motive power (traction or deep cycle) and stationary (UPS).

Starter Batteries

The starter battery is designed to crank an engine with a momentary high-power load lasting a second or so. For its size, the battery is able to deliver high current but it cannot be deep-cycled. Starter batteries are rated with Ah or RS (reserve capacity) to indicate energy storage capability, as well as CCA (cold cranking amps) to signify the current a battery can deliver at cold temperature. SAE J537 specifies 30 seconds of discharge at –18°C (0°F) at the rated CCA ampere without the battery voltage dropping below 7.2 volts. RC reflects the runtime in minutes at a steady discharge of 25. (SAE stands for Society of Automotive Engineers.) See also BU-902a: How to Measure CCA.

Starter batteries have a very low internal resistance that is achieved by adding extra plates for maximum surface area (Figure 1). The plates are thin and the lead is applied in a sponge-like form that has the appearance of fine foam, expanding the surface area further. Plate thickness, which is important for a deep-cycle battery is less important because the discharge is short and the battery is recharged while driving; the emphasis is on power rather than capacity.

Figure 1: Starter battery
The starter battery has many thin plates in parallel to achieve low resistance with high surface area. The starter battery does not allow deep cycling.
Courtesy of Cadex

Deep-cycle Battery

The deep-cycle battery is built to provide continuous power for wheelchairs, golf cars, forklifts and more. This battery is built for maximum capacity and a reasonably high cycle count. This is achieved by making the lead plates thick (Figure 2). Although the battery is designed for cycling, full discharges still induce stress and the cycle count relates to the depth-of-discharge (DoD). Deep-cycle batteries are marked in Ah or minutes of runtime. The capacity is typically rated as a 5-hour and 20-hour discharge.

Figure 2: Deep-cycle battery
The deep-cycle battery has thick plates for improved cycling abilities. The deep-cycle battery generally allows about 300 cycles.
Courtesy of Cadex

A starter battery cannot be swapped with a deep-cycle battery or vice versa. While an inventive senior may be tempted to install a starter battery instead of the more expensive deep-cycle on his wheelchair to save money, the starter battery would not last because the thin sponge-like plates would quickly dissolve with repeated deep cycling.

There are combination starter/deep-cycle batteries available for trucks, buses, public safety and military vehicles, but these units are big and heavy. As a simple guideline, the heavier the battery is, the more lead it contains, and the longer it will last. Table 3 compares the typical life of starter and deep-cycle batteries when deep cycled.

Depth of discharge

Starter battery

Deep-cycle battery

100%

50%

30%

12–15 cycles

100–120 cycles

130–150 cycles

150–200 cycles

400–500 cycles

1,000 and more cycles

Table 3: Cycle performance of starter and deep-cycle batteries. A discharge of 100% refers to a full discharge; 50% is half and 30% is a moderate discharge with 70% remaining.

Lead Acid or Li-ion in your Car?

Ever since Cadillac introduced the starter motor in 1912, lead acid batteries served well as battery of choice. Thomas Edison tried to replace lead acid with nickel-iron (NiFe), but lead acid prevailed because of its rugged and forgiving nature, as well as low cost. Now the lead acid serving as starter battery in vehicles is being challenged by Li-ion.

Figure 4 illustrates the characteristics of lead acid and Li-ion. Both chemistries perform similarly in cold cranking. Lead acid is slightly better in W/kg, but Li-ion delivers large improvements in cycle life, better specific energy in Wh/kg and good dynamic charge acceptance. Where Li-ion falls short is high cost per kWh, complex recycling and less stellar safety record than lead acid.

Figure 4: Comparison of lead acid and Li-ion as starter battery.
Lead acid maintains a strong lead in starter battery. Credit goes to good cold temperature performance, low cost, good safety record and ease of recycling.
Source: Johnson Control

Lead is toxic and environmentalists would like to replace the lead acid battery with an alternative chemistry. Europe succeeded in keeping NiCd out of consumer products, and similar efforts are being made with the starter battery. The choices are NiMH and Li-ion, but the price is too high and low temperature performance is poor. With a 99 percent recycling rate, the lead acid battery poses little environmental hazard and will likely continue to be the battery of choice.

Table 4 lists advantages and limitations of common lead acid batteries in use today. The table does not include the new lead acid chemistries. (See also BU-202: New Lead Acid Systems.)

Advantages

Inexpensive and simple to manufacture; low cost per watt-hour

Low self-discharge; lowest among rechargeable batteries

High specific power, capable of high discharge currents

Good low and high temperature performance

Limitations

Low specific energy; poor weight-to-energy ratio

Slow charge; fully saturated charge takes 14-16 hours

Must be stored in charged condition to prevent sulfation

Limited cycle life; repeated deep-cycling reduces battery life

Flooded version requires watering

Transportation restrictions on the flooded type

Not environmentally friendly

Table 4: Advantages and limitations of lead acid batteries. Dry systems have advantages over flooded but are less rugged.

Himax - New-Battery-Technologies

Analyze the pros and cons of other battery systems and learn what the potentials are.

The media promotes wonderful new batteries that promise long runtimes, charge in minutes, are paper-thin and will one day power the electric car. While these experimental batteries produce a voltage, the downsides are seldom mentioned. The typical shortcomings are low load capacity and short cycle life. (See BU-104c: The Octagon Battery.)

As a lemon can be made into a battery, so also has seawater been tried as electrolyte, but the retrieved energy is only good to light an incandescent flashlight for a short time before corrosion buildup renders the battery unusable. Many chemical processes are being tried to generate electricity from diverse metals but only a few promise to surpass today’s lead, nickel and lithium systems.

There is much media hype, and this may be done in part to attract venture capitalists to fund research projects. Few products have incubation periods that are as long as a battery. Although glamorous and promising at first, especially if the battery promises to power the electric vehicle, investment firms are beginning to realize the high development costs, uncertainties and long gestation periods before a return can be realized. Meanwhile, universities continue publishing papers about battery breakthroughs to keep receiving government funding while private companies throw in a paper or two to appease investors and boost their own stock value.

Zinc-air (Primary & Secondary)

Zinc-air batteries generate electrical power by an oxidation process of zinc and oxygen from the air. The cell can produce 1.65V; however, cells with 1.4V and lower voltages achieve a longer lifetime. To activate the battery, the user removes a sealing tab that enables airflow. The battery reaches full operating voltage within 5 seconds. Airflow can control the rate of the reaction somewhat and once turned on, the battery cannot be reverted back to standby mode. Adding a tape to stop the airflow only slows the chemical activity and battery will soon dry out.

The Zinc-air battery shares similarities with the fuel cell (PEMFC) by using oxygen from the air to fuel the positive electrode. It is considered a primary battery and recharging versions for high-power applications have been tried. Recharging occurs by replacing the spent zinc electrodes, which can be in the form of a zinc electrolyte paste. Other zinc-air batteries use zinc pellets.

At 300–400Wh/kg, zinc-air has a high specific energy but the specific power is low. Manufacturing cost is low and in a sealed state, zinc-air has a 2 percent self-discharge per year. The battery is sensitive to hot and cold temperatures and high humidity. Pollution also affects performance; high carbon dioxide content reduces the performance by increasing the internal resistance. Typical applications are hearing aids while large systems operate remote railway signaling and safety lamps at construction sites.

Silver-zinc (Primary & Secondary)

The small silver-based batteries in button cells are typically called silver-oxide and are non-rechargeable; the higher capacity rechargeable versions are referred to as silver-zinc. Both have an open circuit voltage of 1.60 volts. Because of the high cost of silver, these batteries come in either very small sizes where the amount of silver does not contribute significantly to the overall product cost, or they are available in larger sizes for critical applications where the superior performance outweighs any cost considerations.

The primary cells are used for watches, hearing aids and memory backup; the larger rechargeable version is found in submarines, missiles and aerospace applications. Silver-zinc also powers TV cameras needing extra runtime. High cost and short service life locked the silver-zinc out of the commercial market, but it is on the verge of a rebirth with improvements.

The primary cause of failure in the original design was the decaying of the zinc electrode and separator. Cycling developed zinc dendrites that pierced through the separator, causing electrical shorts. In addition, the separator degraded by sitting in the potassium hydroxide electrolyte. This limited the calendar life to about 2 years.

Improvements in the zinc electrode and separator promise a longer service life and a 40 percent higher specific energy than Li-ion. Silver-zinc is safe, has no toxic metals and can be recycled, but the use of silver makes the battery expensive to manufacture.

Reusable Alkaline

The reusable alkaline served as an alternative to disposable batteries. Although fabrication costs were said to be similar to regular alkaline, the consumer did not accept the product.

Recharging alkaline batteries is not new. Ordinary alkaline batteries have been recharged in households for many years. Recharging is most effective if alkaline is discharged to less than 50 percent before recharging. The number of recharges depends on the depth of discharge and is limited to just a few cycles. Battery makers do not endorse this practice for safety reasons; charging ordinary alkaline batteries may generate hydrogen gas that can lead to an explosion.

The reusable alkaline overcomes some of these deficiencies, but a limited cycle count and low capacity on repeat charge are major drawbacks. Longevity is also in direct relationship to the depth of discharge. At a 50 percent depth of discharge, the battery may deliver 50 cycles, but most users run a battery empty before recharging and the manufacturer, including the inventor Karl Kordesch, overestimated the eagerness of the user wanting to recharge early. An additional limitation is its low load current of 400mA, which is only sufficient for flashlights and personal entertainment devices. NiMH in AA and AAA cells has mostly replaced the reusable alkaline.

Cycling Performance(Data trend chart)

Find out how NiCd, NiMH and Li-ion perform when put to the test.

To compare older and newer battery systems, Cadex tested a large volume of nickel-cadmium, nickel-metal-hydride and lithium ion batteries used in portable communication devices. Preparations included an initial charge, followed by a regime of full discharge/charge cycles at a 1C rate. The following tables show the capacity in percent, DC resistance measurement and self-discharge obtained from time to time by reading the capacity loss incurred during a 48-hour rest period. The tests were carried out on the Cadex 7000 Series battery analyzers with a 1C charge and discharge and a 100 percent depth-of-discharge (DoD).

Nickel-cadmium

In terms of life cycling, NiCd is the most enduring battery. Figure 1 illustrates capacity, internal resistance and self-discharge of a 7.2V, 900mA pack with standard NiCd cell. The internal resistance stayed low at 75m and the self-discharge was stable. Due to time constraints, the test was terminated after 2,300 cycles.

This battery receives a grade “A” rating for almost perfect performance in terms of minimal capacity loss when cycling with a 100 percent DoD and rock-solid internal resistance over the entire test. NiCd is the only chemistry that can be ultra-fast charged with little stress. Due to its safe operation, NiCd remains the preferred choice of battery onboard aircraft.

Performance of standard NiCd

Figure 1: Performance of standard NiCd (7.2V, 900mAh)
This battery receives an “A” rating for stable capacity, low internal resistance and moderate self-discharge over many cycles.
Courtesy of Cadex

The ultra-high-capacity nickel-cadmium offers up to 60 percent higher specific energy compared to the standard version, however, this comes at the expense of reduced cycle life. In Figure 2 we observe a steady drop of capacity during 2,000 cycles, a slight increase in internal resistance and a rise in self-discharge after 1,000 cycles.

Performance of ultra-high-capacity NiCd

Figure 2: Performance of ultra-high-capacity NiCd (6V, 700mAh)
This battery offers higher specific energy than the standard version at the expense of reduced cycle life.
Courtesy of Cadex

Nickel-metal-hydride

Figure 3 examines NiMH, a battery that offers high specific energy but loses capacity after the 300-cycle mark. There is also a rapid increase in internal resistance after a cycle count of 700 and a rise in self-discharge after 1000 cycles. The test was done on an older generation NiMH.

Performance of NiMH

Figure 3: Performance of NiMH (6V, 950mAh).
This battery offers good performance at first but past 300 cycles, the capacity, internal resistance and self-discharge start to increase rapidly.
Courtesy of Cadex

Lithium-ion

Figure 4 examines the capacity fade of a modern Li-ion Power Cell at a 2A, 10A, 15A and 20A discharge. Stresses increase with higher load currents, and this also applies to fast charging. (See BU-401a: Ultra-fast charging of Li-ion.)

Li-ion manufacturers seldom specify the rise of internal resistance and self-discharge as a function of cycling. Advancements have been made with electrolyte additives that keep the resistance low through most of the battery life. The self-discharge of Li-ion is normally low but it can increase if misused or if exposed to deep discharges.

Performance of lithium-ion

Figure 4: Cycle characteristics of IHR18650C by E-One Moli. (3.6V, 2,000mA). 18650 Power Cell was charged with 2A and discharged at 2, 10, 15 and 20A. The internal resistance and self-discharge are N/A.
Courtesy of E-One Moli Energy

Batteries tested in a laboratory tend to provide better results than in the field. Elements of stress in everyday use do not always transfer well into a test laboratory. Aging plays a negligible role in a lab because the batteries are cycled over a period of a few months rather than the expected service life of several years. The temperature is often moderate and the batteries are charged under controlled charging condition and with approved chargers.

The load signature also plays a role as all batteries were discharged with a DC load. Batteries tend to have a lower cycle life if discharged with pulses. (See BU-501: Basics About Discharging.) Do not overstress a battery as this will shorten the life. If a battery must repeatedly be loaded at peak currents, choose a pack with increased Ah rating.

How to Measure State-of-charge(Cover)

Explore SoC measurements and why they are not accurate.

Voltage Method

Measuring state-of-charge by voltage is simple, but it can be inaccurate because cell materials and temperature affect the voltage. The most blatant error of the voltage-based SoC occurs when disturbing a battery with a charge or discharge. The resulting agitation distorts the voltage and it no longer represents a correct SoC reference. To get accurate readings, the battery needs to rest in the open circuit state for at least four hours; battery manufacturers recommend 24 hours for lead acid. This makes the voltage-based SoC method impractical for a battery in active duty.

Each battery chemistry delivers its own unique discharge signature. While voltage-based SoC works reasonably well for a lead acid battery that has rested, the flat discharge curve of nickel- and lithium-based batteries renders the voltage method impracticable.

The discharge voltage curves of Li-manganese, Li-phosphate and NMC are very flat, and 80 percent of the stored energy remains in the flat voltage profile. While this characteristic is desirable as an energy source, it presents a challenge for voltage-based fuel gauging as it only indicates full charge and low charge; the important middle section cannot be estimated accurately. Figure 1 reveals the flat voltage profile of Li-phosphate (LiFePO) batteries.

Figure 1: Discharge voltage of lithium iron phosphate.
Li-phosphate has a very flat discharge profile, making voltage estimations for SoC estimation difficult.

Lead acid comes with different plate compositions that must be considered when measuring SoC by voltage. Calcium, an additive that makes the battery maintenance-free, raises the voltage by 5–8 percent. In addition, heat raises the voltage while cold causes a decrease. Surface charge further fools SoC estimations by showing an elevated voltage immediately after charge; a brief discharge before measurement counteracts the error. Finally, AGM batteries produce a slightly higher voltage than the flooded equivalent.

When measuring SoC by open circuit voltage (OCV), the battery voltage must be “floating” with no load attached. This is not the case with modern vehicles. Parasitic loads for housekeeping functions puts the battery into a quasi-closed circuit voltage (CCV) condition.

In spite of inaccuracies, most SoC measurements rely in part or completely on voltage because of simplicity. Voltage-based SoC is popular in wheelchairs, scooters and golf cars. Some innovative BMS (battery management systems) use the rest periods to adjust the SoC readings as part of a “learn” function. Figure 2 illustrates the voltage band of a 12V lead acid monoblock from fully discharged to full charged.

Figure 2: Voltage band of a 12V lead acid monoblock from fully discharged to fully charged.Source: Power-Sonic

Hydrometer

The hydrometer offers an alternative to measuring SoC of flooded lead acid batteries. Here is how it works: When the lead acid battery accepts charge, the sulfuric acid gets heavier, causing the specific gravity (SG) to increase. As the SoC decreases through discharge, the sulfuric acid removes itself from the electrolyte and binds to the plate, forming lead sulfate. The density of the electrolyte becomes lighter and more water-like, and the specific gravity gets lower. Table 2 provides the BCI readings of starter batteries.

Approximate
state-of-charge
Average
specific gravity
Open circuit voltage
2V 6V 8V 12V
100% 1.265 2.10 6.32 8.43 12.65
75% 1.225 2.08 6.22 8.30 12.45
50% 1.190 2.04 6.12 8.16 12.24
25% 1.155 2.01 6.03 8.04 12.06
0% 1.120 1.98 5.95 7.72 11.89

Table 2: BCI standard for SoC estimation of a starter battery with antimony.
Readings are taken at 26°C (78°F) after a 24h rest.

While BCI (Battery Council International) specifies the specific gravity of a fully charged starter battery at 1.265, battery manufacturers may go for 1.280 and higher. Increasing the specific gravity will move the SoC readings upwards on the look-up table. A higher SG will improve battery performance but shorten battery life because of increased corrosion activity.

Besides charge level and acid density, a low fluid level will also change the SG. When water evaporates, the SG reading rises because of higher concentration. The battery can also be overfilled, which lowers the number. When adding water, allow time for mixing before taking the SG measurement.

Specific gravity varies with battery applications. Deep-cycle batteries use a dense electrolyte with an SG of up to 1.330 to get maximum specific energy; aviation batteries have an SG of about 1.285; traction batteries for forklifts are typically at 1.280; starter batteries come in at 1.265; and stationary batteries have a low specific gravity of 1.225. This reduces corrosion and prolongs life but it decreases the specific energy, or capacity.

Nothing in the battery world is absolute. The specific gravity of fully charged deep-cycle batteries of the same model can range from 1.270 to 1.305; fully discharged, these batteries may vary between 1.097 and 1.201. Temperature is another variable that alters the specific gravity reading. The colder the temperature drops, the higher (more dense) the SG value becomes. Table 3 illustrates the SG gravity of a deep-cycle battery at various temperatures.

Electrolyte temperature Gravity at full charge Table 3: Relationship of specific gravity and temperature of deep-cycle battery.

Colder temperatures provide higher specific gravity readings.

40°C 104°F 1.266
30°C 86°F 1.273
20°C 68°F 1.280
10°C 50°F 1.287
0°C 32°F 1.294

Inaccuracies in SG readings can also occur if the battery has stratified, meaning the concentration is light on top and heavy on the bottom. (See BU-804c: Water Loss, Acid Stratification and Surface Charge.). High acid concentration artificially raises the open circuit voltage, which can fool SoC estimations through false SG and voltage indication. The electrolyte needs to stabilize after charge and discharge before taking the SG reading.

Coulomb Counting

Laptops, medical equipment and other professional portable devices use coulomb counting to estimate SoC by measuring the in-and-out-flowing current. Ampere-second (As) is used for both charge and discharge. The name “coulomb” was given in honor of Charles-Augustin de Coulomb (1736–1806) who is best known for developing Coulomb’s law. (See BU-601: How does a Smart Battery Work?)

While this is an elegant solution to a challenging issue, losses reduce the total energy delivered, and what’s available at the end is always less than what had been put in. In spite of this, coulomb counting works well, especially with Li-ion that offer high coulombinc efficiency and low self-discharge. Improvements have been made by also taking aging and temperature-based self-discharge into consideration but periodic calibration is still recommended to bring the “digital battery” in harmony with the “chemical battery.” (See BU-603: How to Calibrate a “Smart” Battery)

To overcome calibration, modern fuel gauges use a “learn” function that estimates how much energy the battery delivered on the previous discharge. Some systems also observe the charge time because a faded battery charges more quickly than a good one.

Makers of advanced BMS claim high accuracies but real life often shows otherwise. Much of the make-believe is hidden behind a fancy readout. Smartphones may show a 100 percent charge when the battery is only 90 percent charged. Design engineers say that the SoC readings on new EV batteries can be off by 15 percent. There are reported cases where EV drivers ran out of charge with a 25 percent SoC reading still on the fuel gauge.

Impedance Spectroscopy

Battery state-of-charge can also be estimated with impedance spectroscopy using the Spectro™ complex modeling method. This allows taking SoC readings with a steady parasitic load of 30A. Voltage polarization and surface charge do not affect the reading as SoC is measured independently of voltage. This opens applications in automotive manufacturing where some batteries are discharged longer than others during testing and debugging and need charging before transit. Measuring SoC by impedance spectroscopy can also be used for load leveling systems where a battery is continuously under charge and discharge.

Measuring SoC independently of voltage also supports dock arrivals and showrooms. Opening the car door applies a parasitic load of about 20A that agitates the battery and falsifies voltage-based SoC measurement. The Spectro™ method helps to identify a low-charge battery from one with a genuine defect.

SoC measurement by impedance spectroscopy is restricted to a new battery with a known good capacity; capacity must be nailed down and have a non-varying value. While SoC readings are possible with a steady load, the battery cannot be on charge during the test.

Figure 4 demonstrates the test results of impedance spectroscopy after a parasitic load of 50A is removed from the battery. As expected, the open terminal voltage rises as part of recovery but the Spectro™ readings remains stable. Steady SoC results are also observed after removing charge during when the voltage normalizes as part of polarization.

Figure 4: Relationship of voltage and measurements taken by impedance spectroscopy after removing a load.
Battery is recovering after removing a load. Spectro SoC readings remain stable as the voltage rises.